library(topr)regionplot
Single GWAS
To display a region around a given gene:
regionplot(CD_UKBB, gene="IL23R")Warning: Using `size` aesthetic for lines was deprecated in ggplot2 3.4.0.
ℹ Please use `linewidth` instead.
ℹ The deprecated feature was likely used in the topr package.
Please report the issue at <https://github.com/totajuliusd/topr/issues>.[1] "Zoomed to region: 1:67038907-67359979"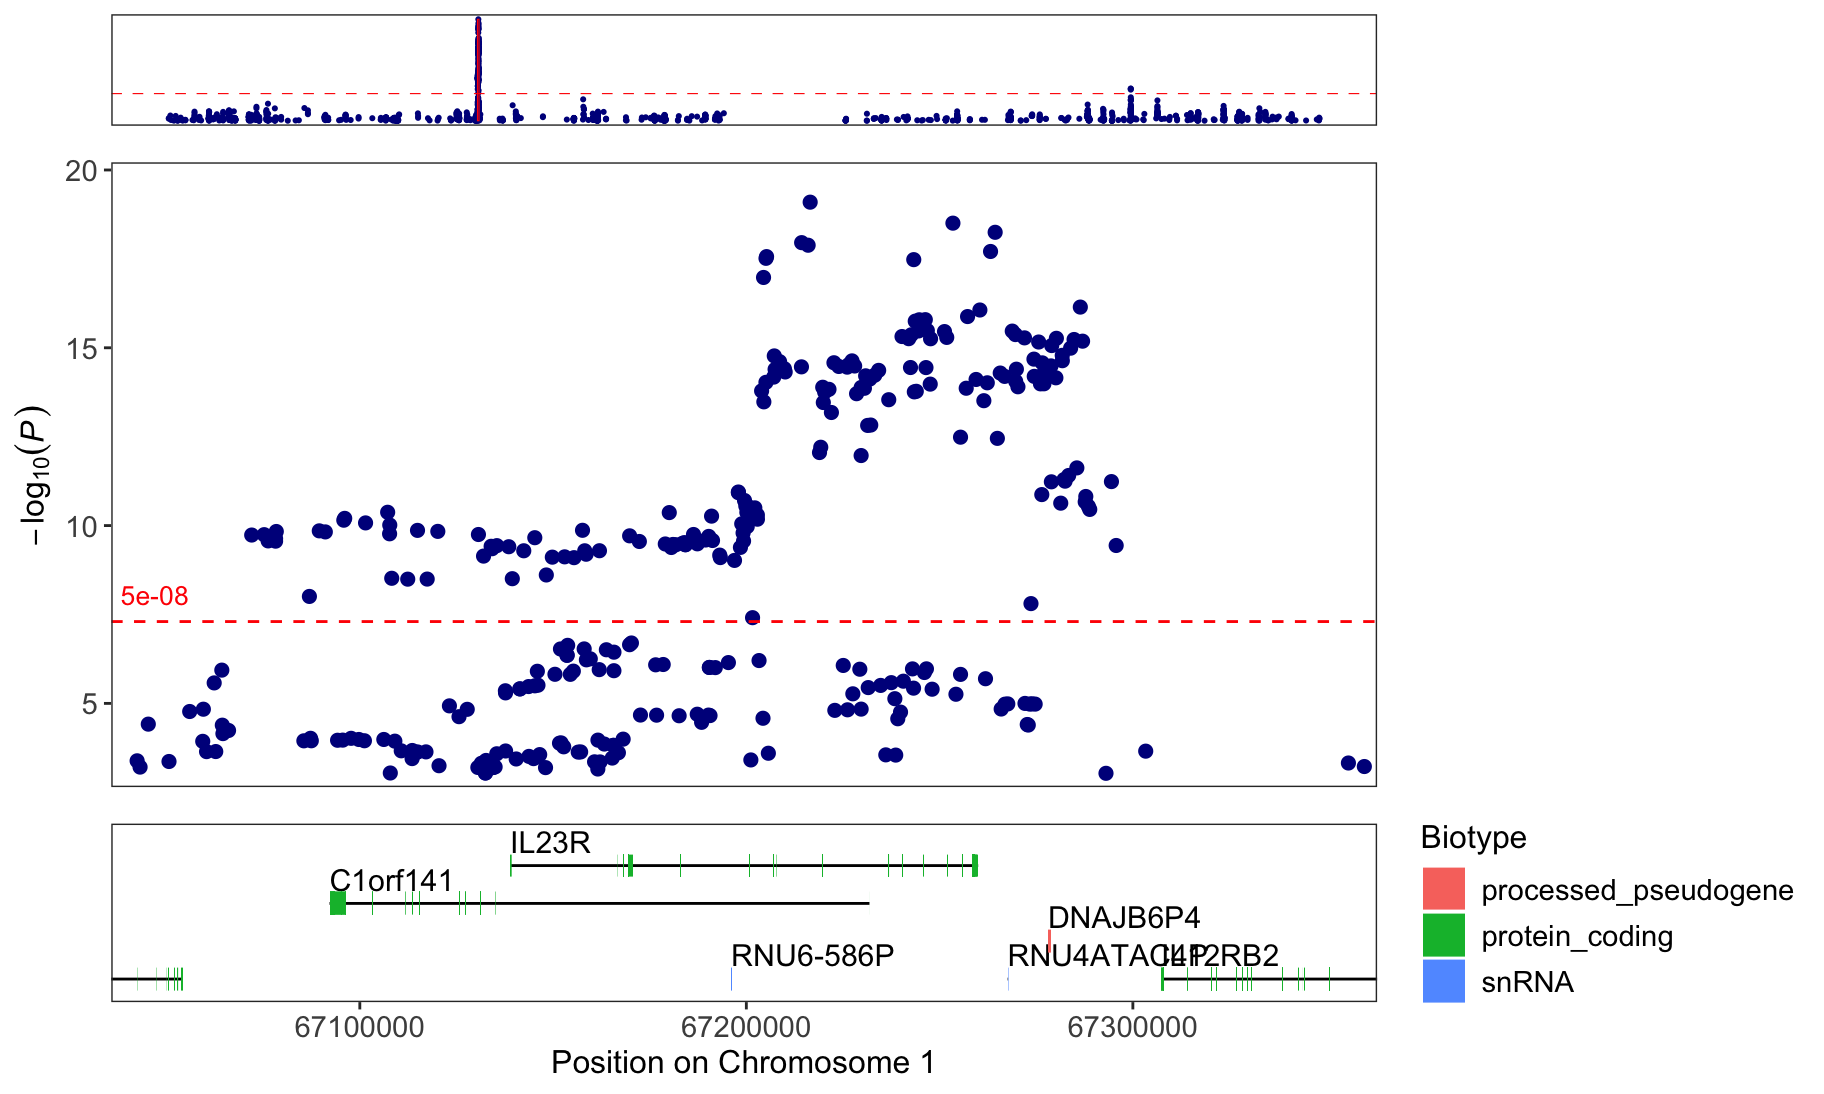
Or alternatively, use the region argument to display the region:
regionplot(CD_UKBB, region="1:67038907-67359979")[1] "Zoomed to region: 1:67038907-67359979"
Label the top marker
regionplot(CD_UKBB, gene="IL23R", annotate=5e-9)[1] "Zoomed to region: 1:67038907-67359979"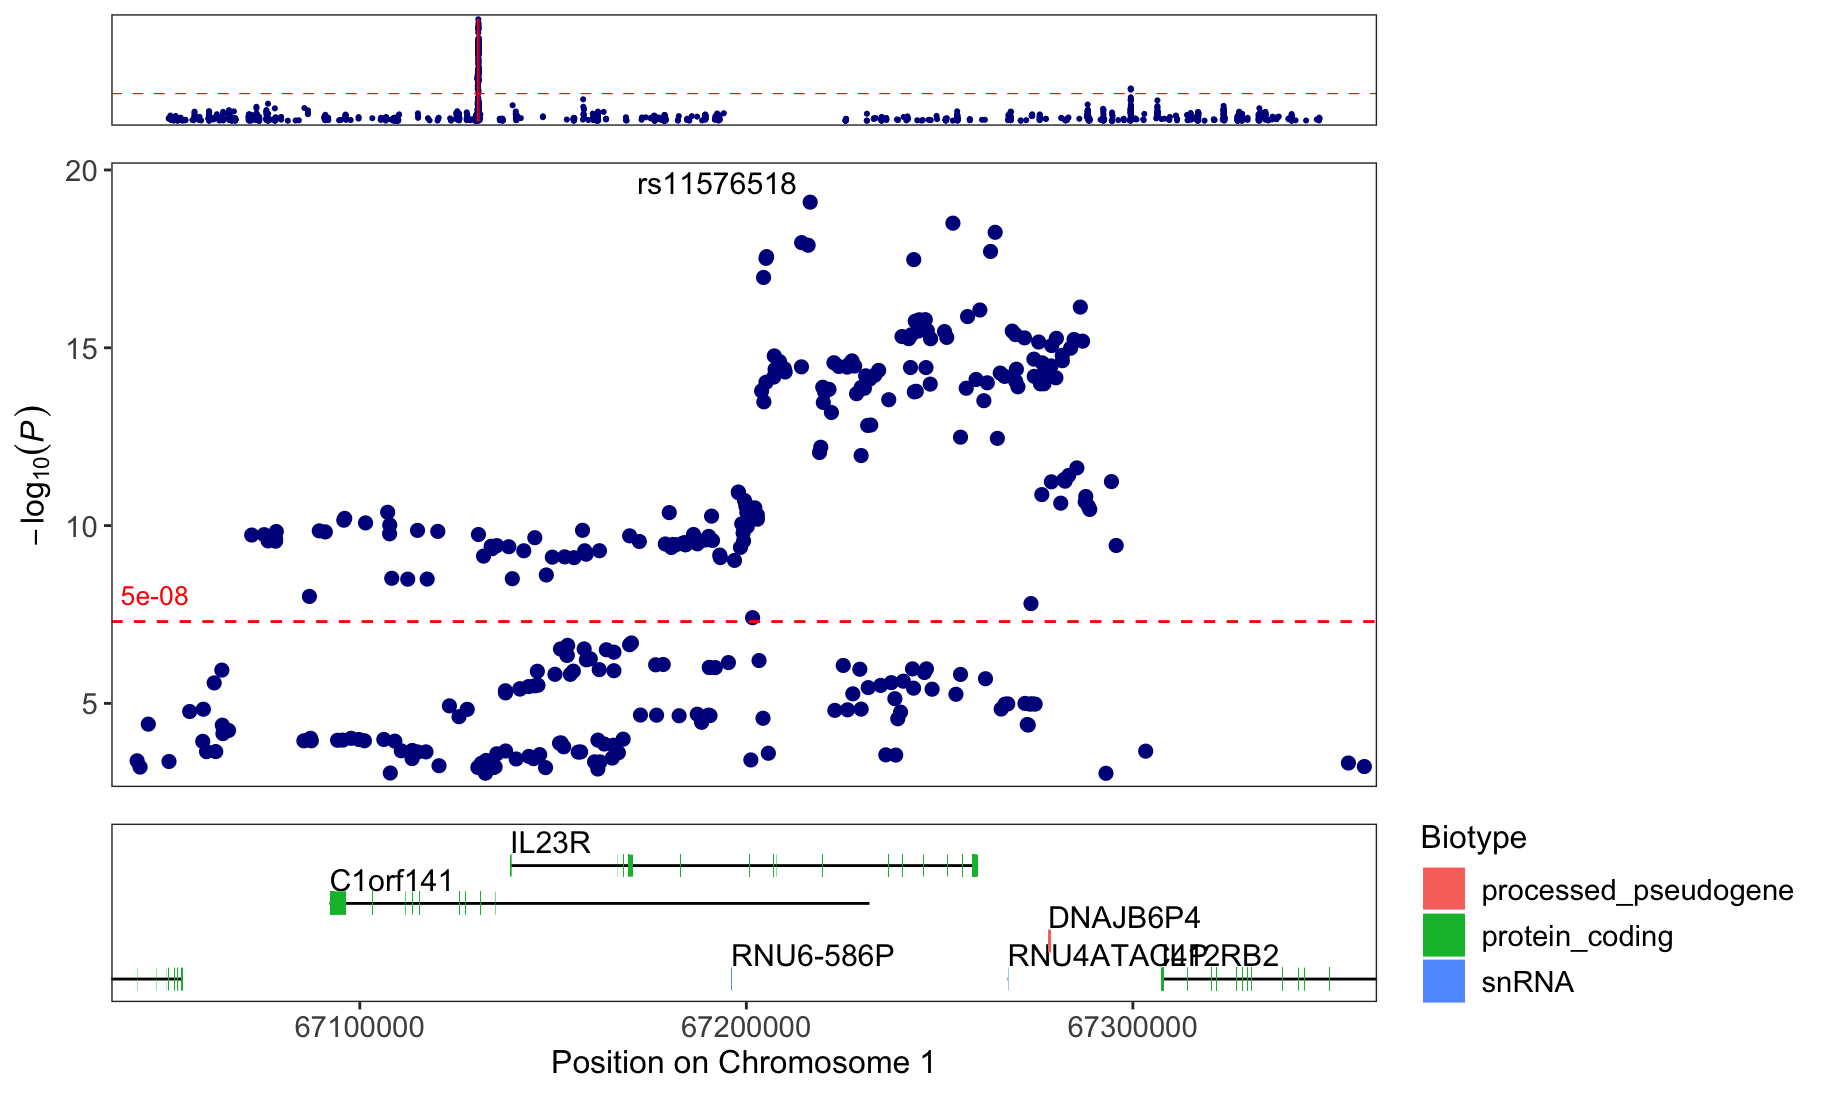
Annotate the top marker per 100000 bp region (region_size=100000) and further highlight the marker position with a vertical line. Move the marker id’s slightly up and towards the right (nudge_y=1 and nudge_x=25000).
regionplot(CD_UKBB, gene="IL23R", annotate_with_vline = 5e-8, region_size = 100000, nudge_y=1, nudge_x=25000)[1] "Zoomed to region: 1:67038907-67359979"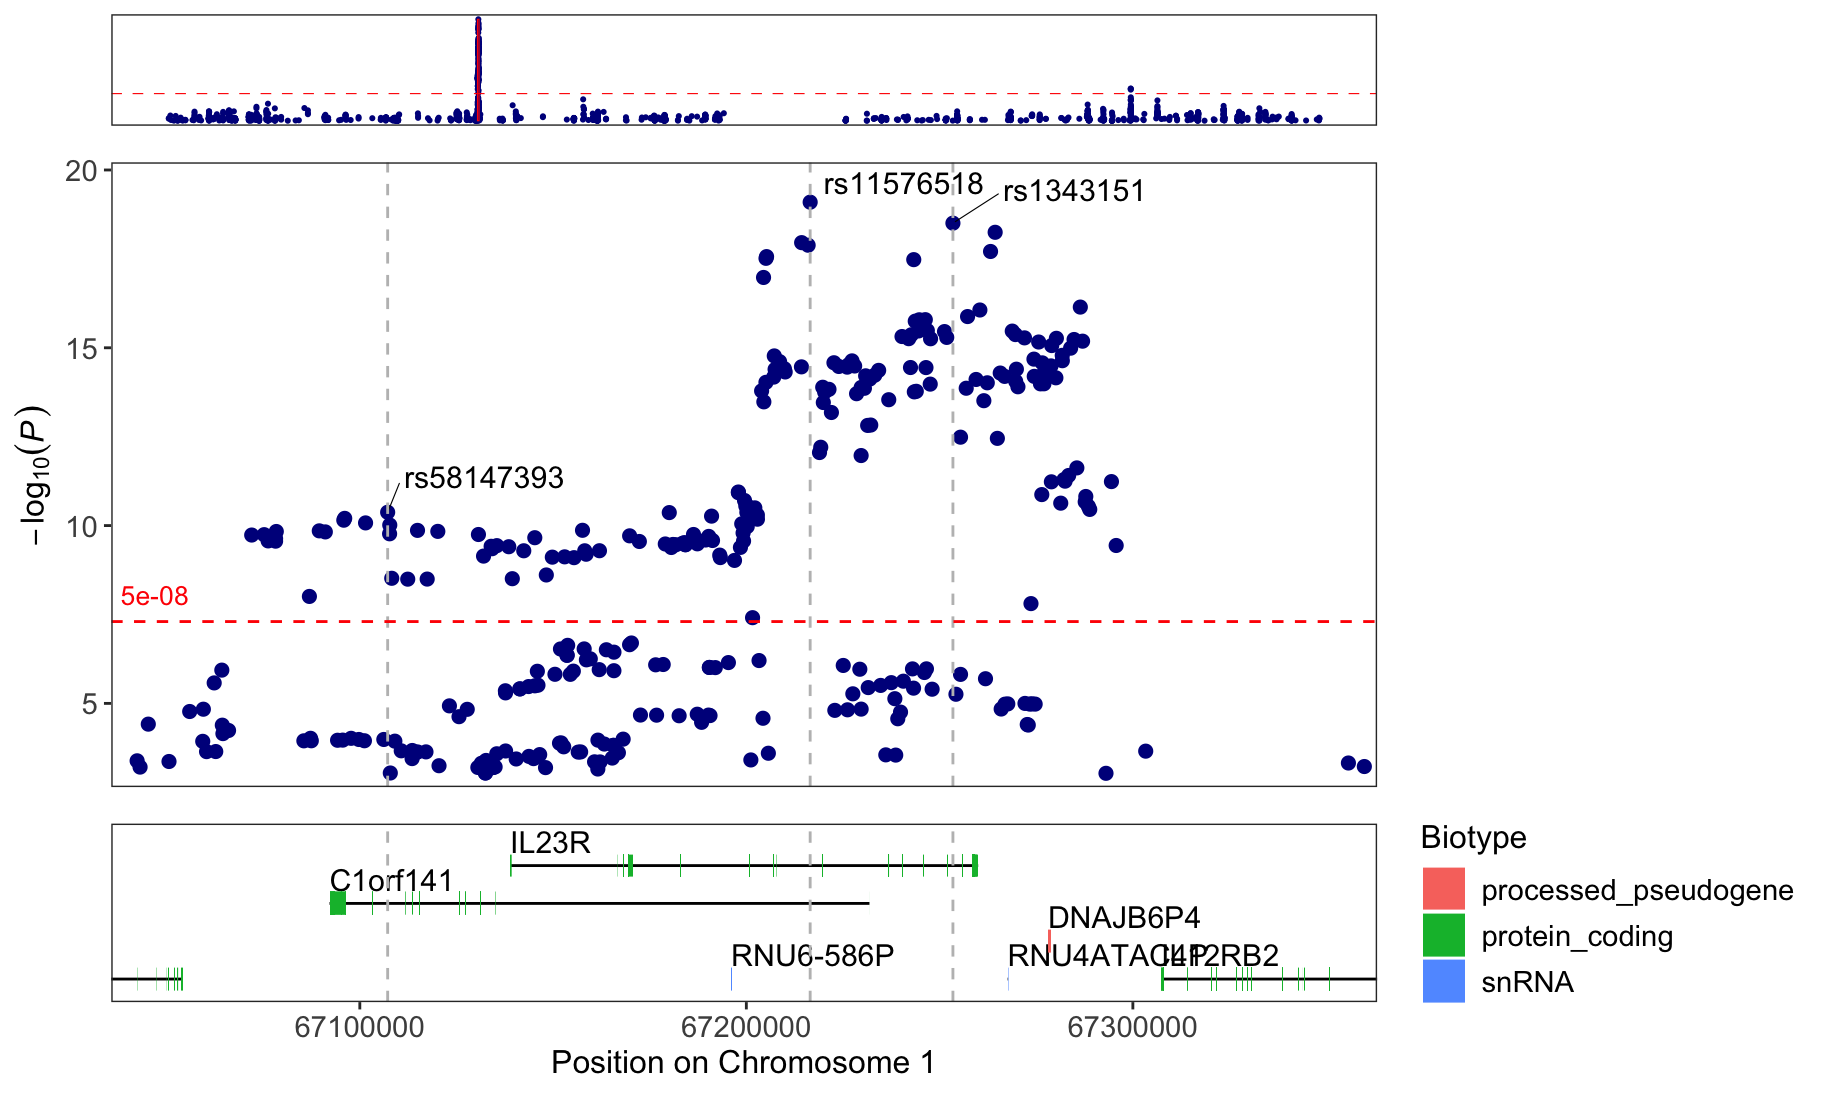
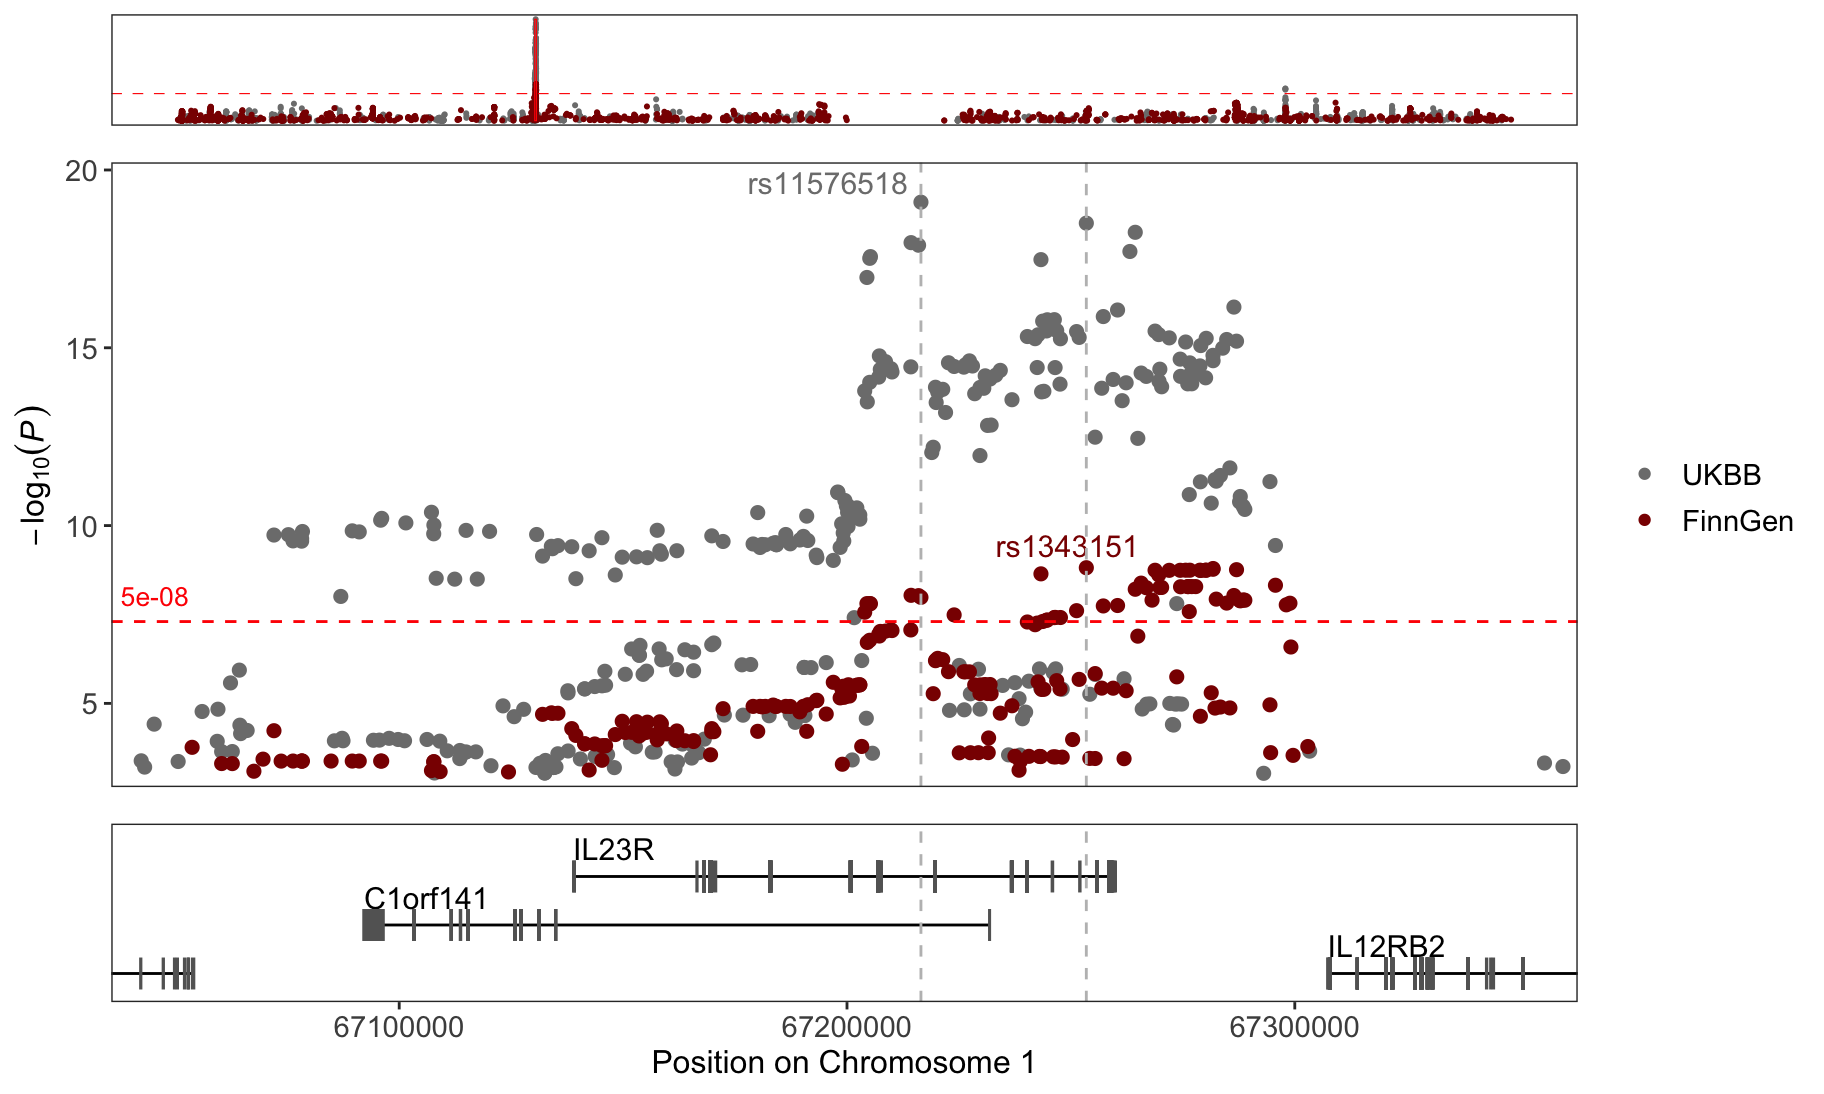
Multi GWAS
regionplot(list(CD_UKBB, CD_FINNGEN), gene="IL23R")[1] "Use the legend_labels argument to change the legend labels from color names to meaningful labels! "
[1] "Zoomed to region: 1:67038907-67359979"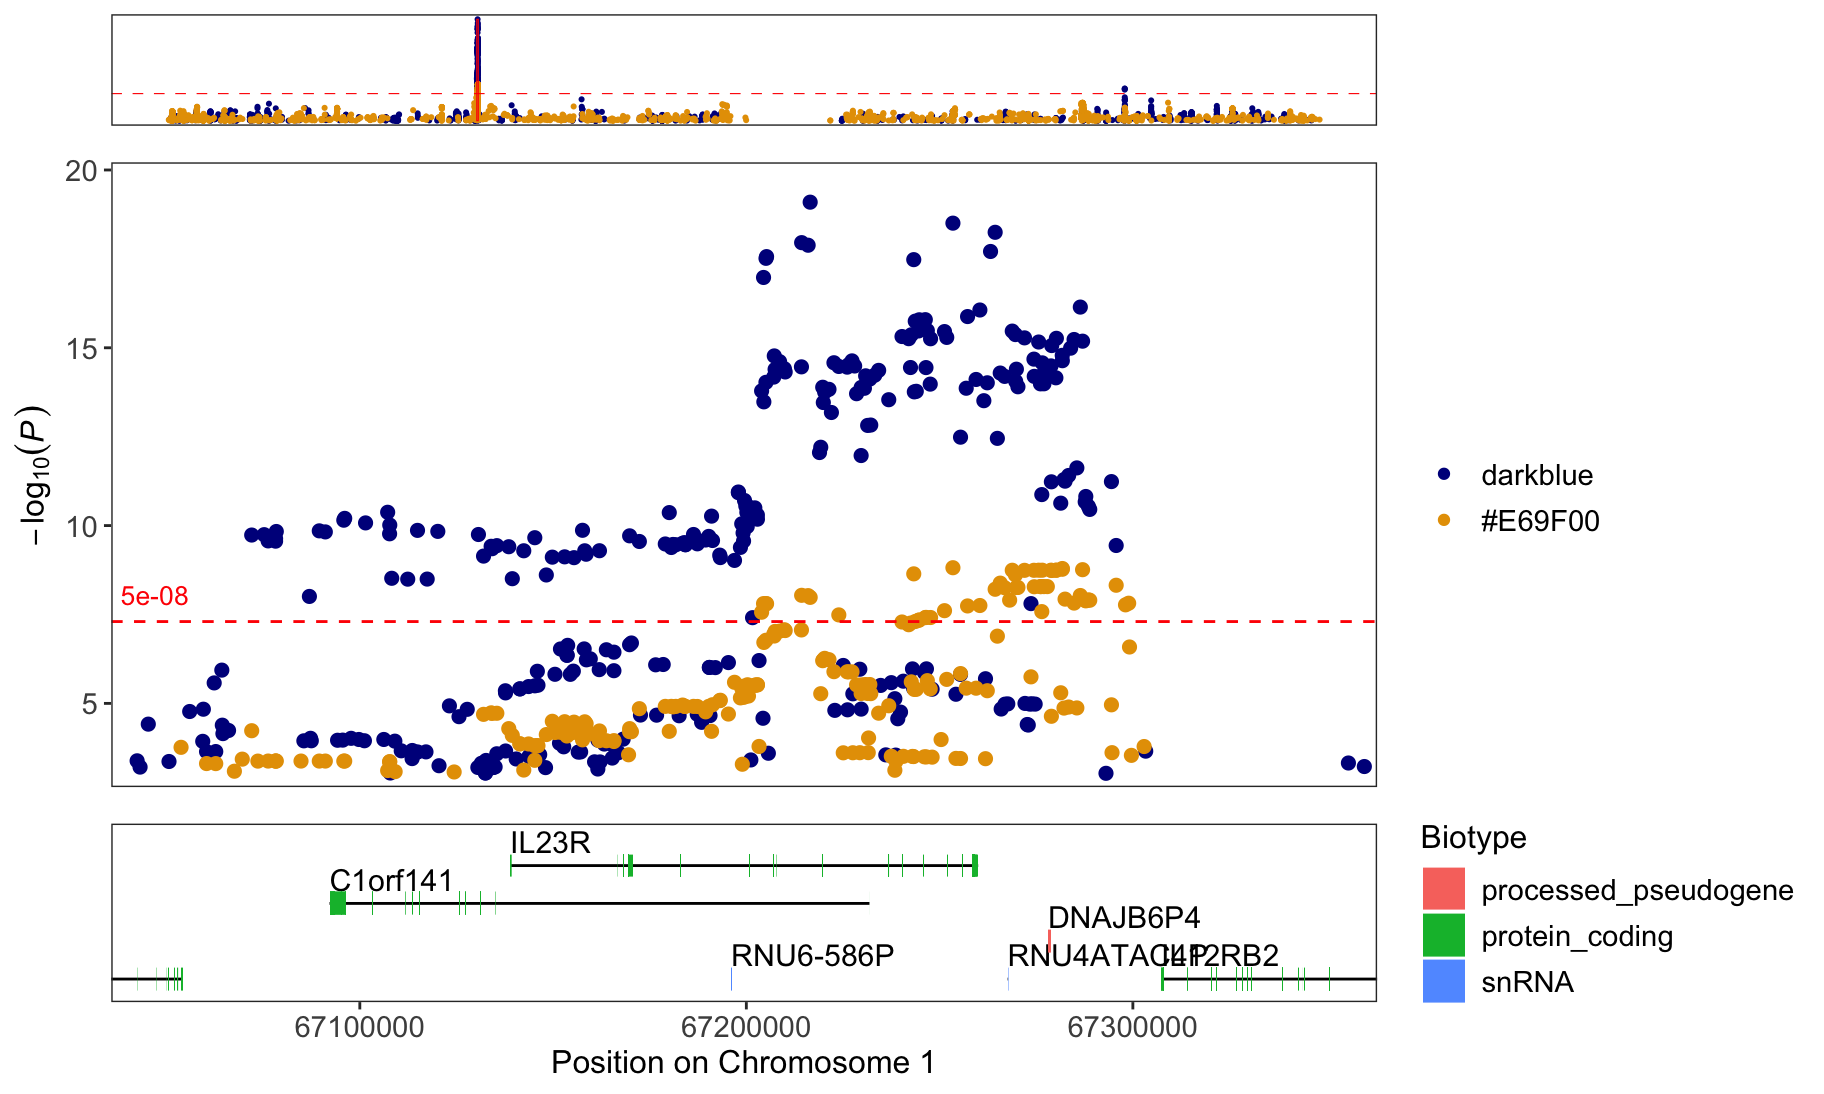
regionplot(list(CD_UKBB, CD_FINNGEN), gene="IL23R", annotate_with_vline =5e-08, color=c("#7D7D7D","darkred"), legend_labels = c("UKBB", "FinnGen"), show_gene_legend = F, protein_coding_only = T, gene_color="#646464")[1] "Zoomed to region: 1:67038907-67359979"