library(topr)topr plot functions
Examples of basic usage. For more examples on how to use each plot function select the function name from the top navigation bar.
manhattan
Single GWAS
manhattan(CD_UKBB, annotate=5e-9)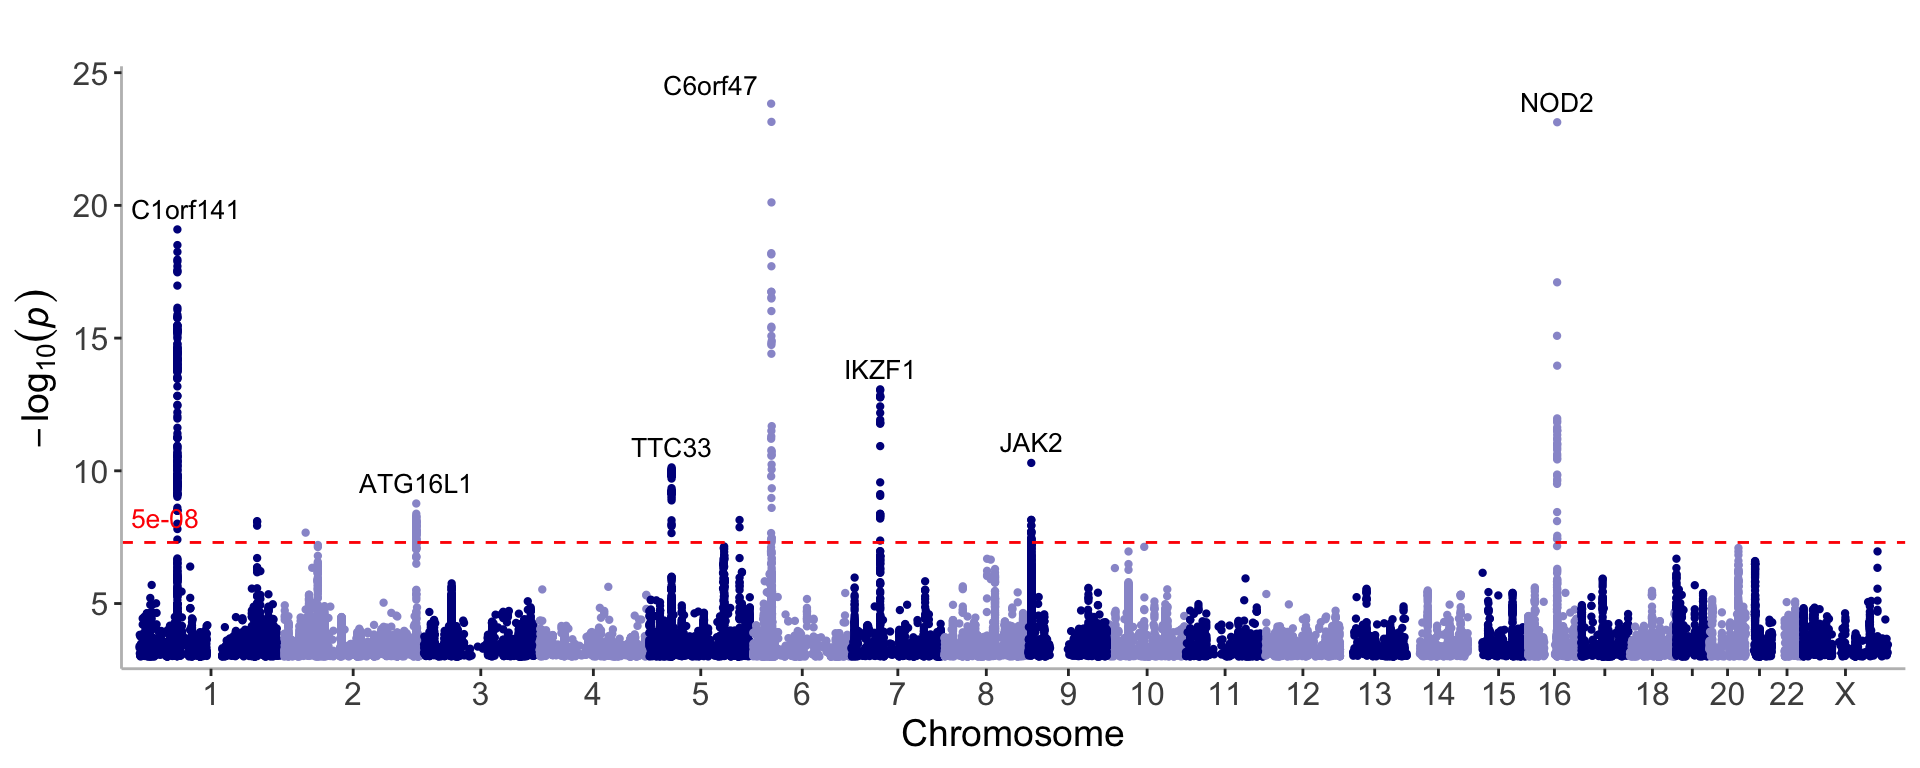
Multi GWAS
manhattan(list(CD_UKBB, CD_FINNGEN), annotate=5e-9)[1] "Use the legend_labels argument to change the legend labels from color names to meaningful labels! "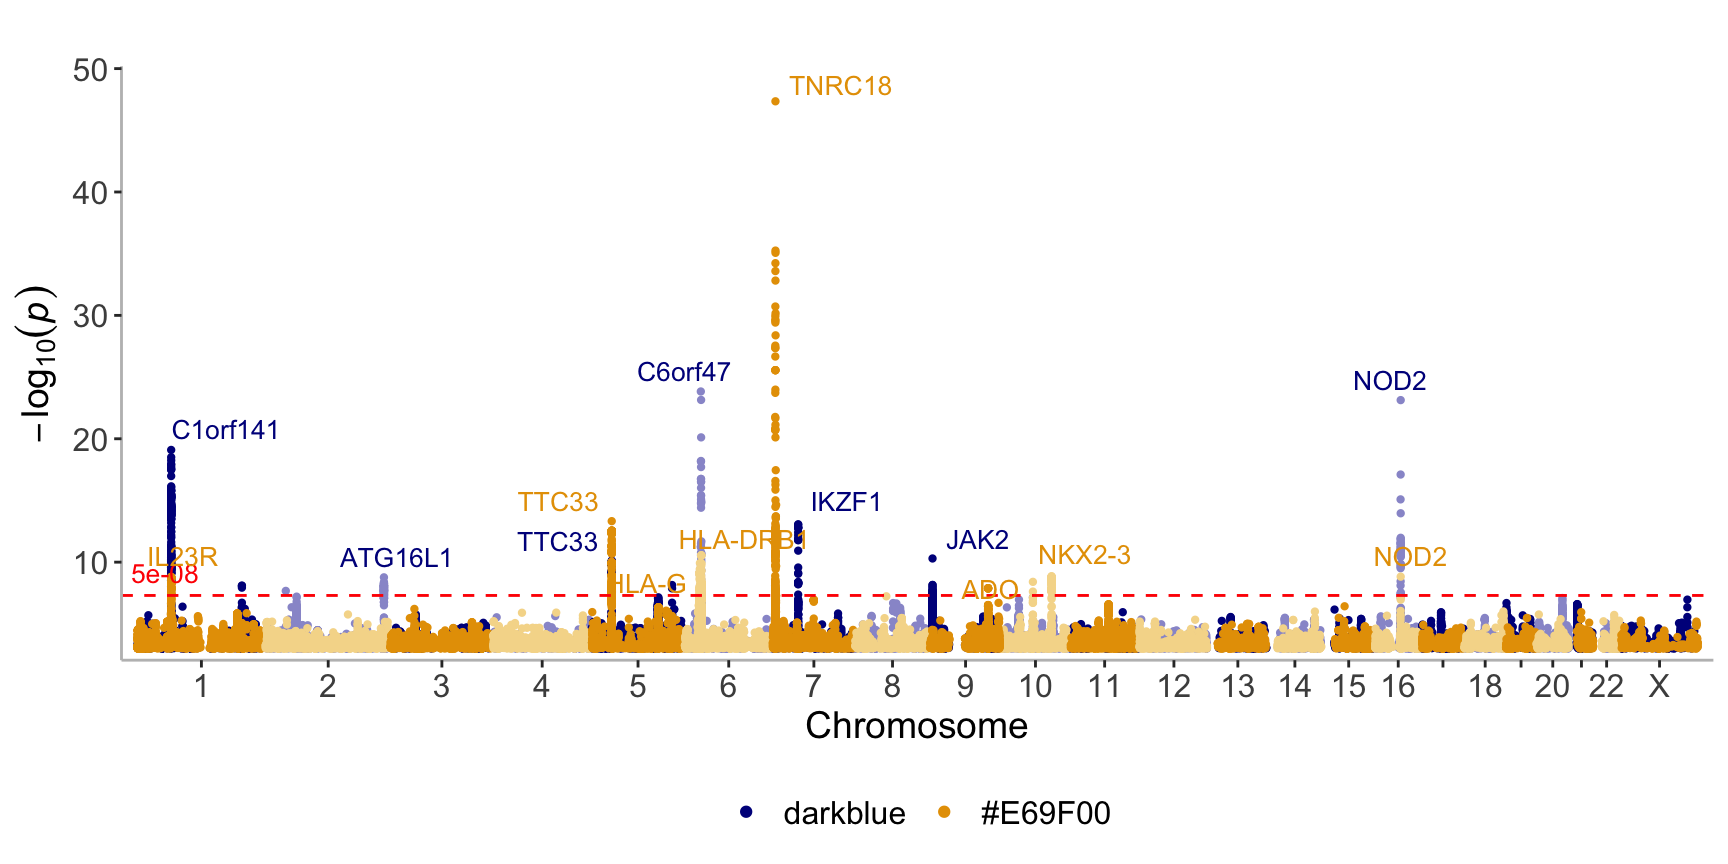
See manhattan for more examples and common use cases.
regionplot
Single GWAS
regionplot(CD_UKBB, gene="IL23R", annotate=5e-9)Warning: Using `size` aesthetic for lines was deprecated in ggplot2 3.4.0.
ℹ Please use `linewidth` instead.
ℹ The deprecated feature was likely used in the topr package.
Please report the issue at <https://github.com/totajuliusd/topr/issues>.[1] "Zoomed to region: 1:67038907-67359979"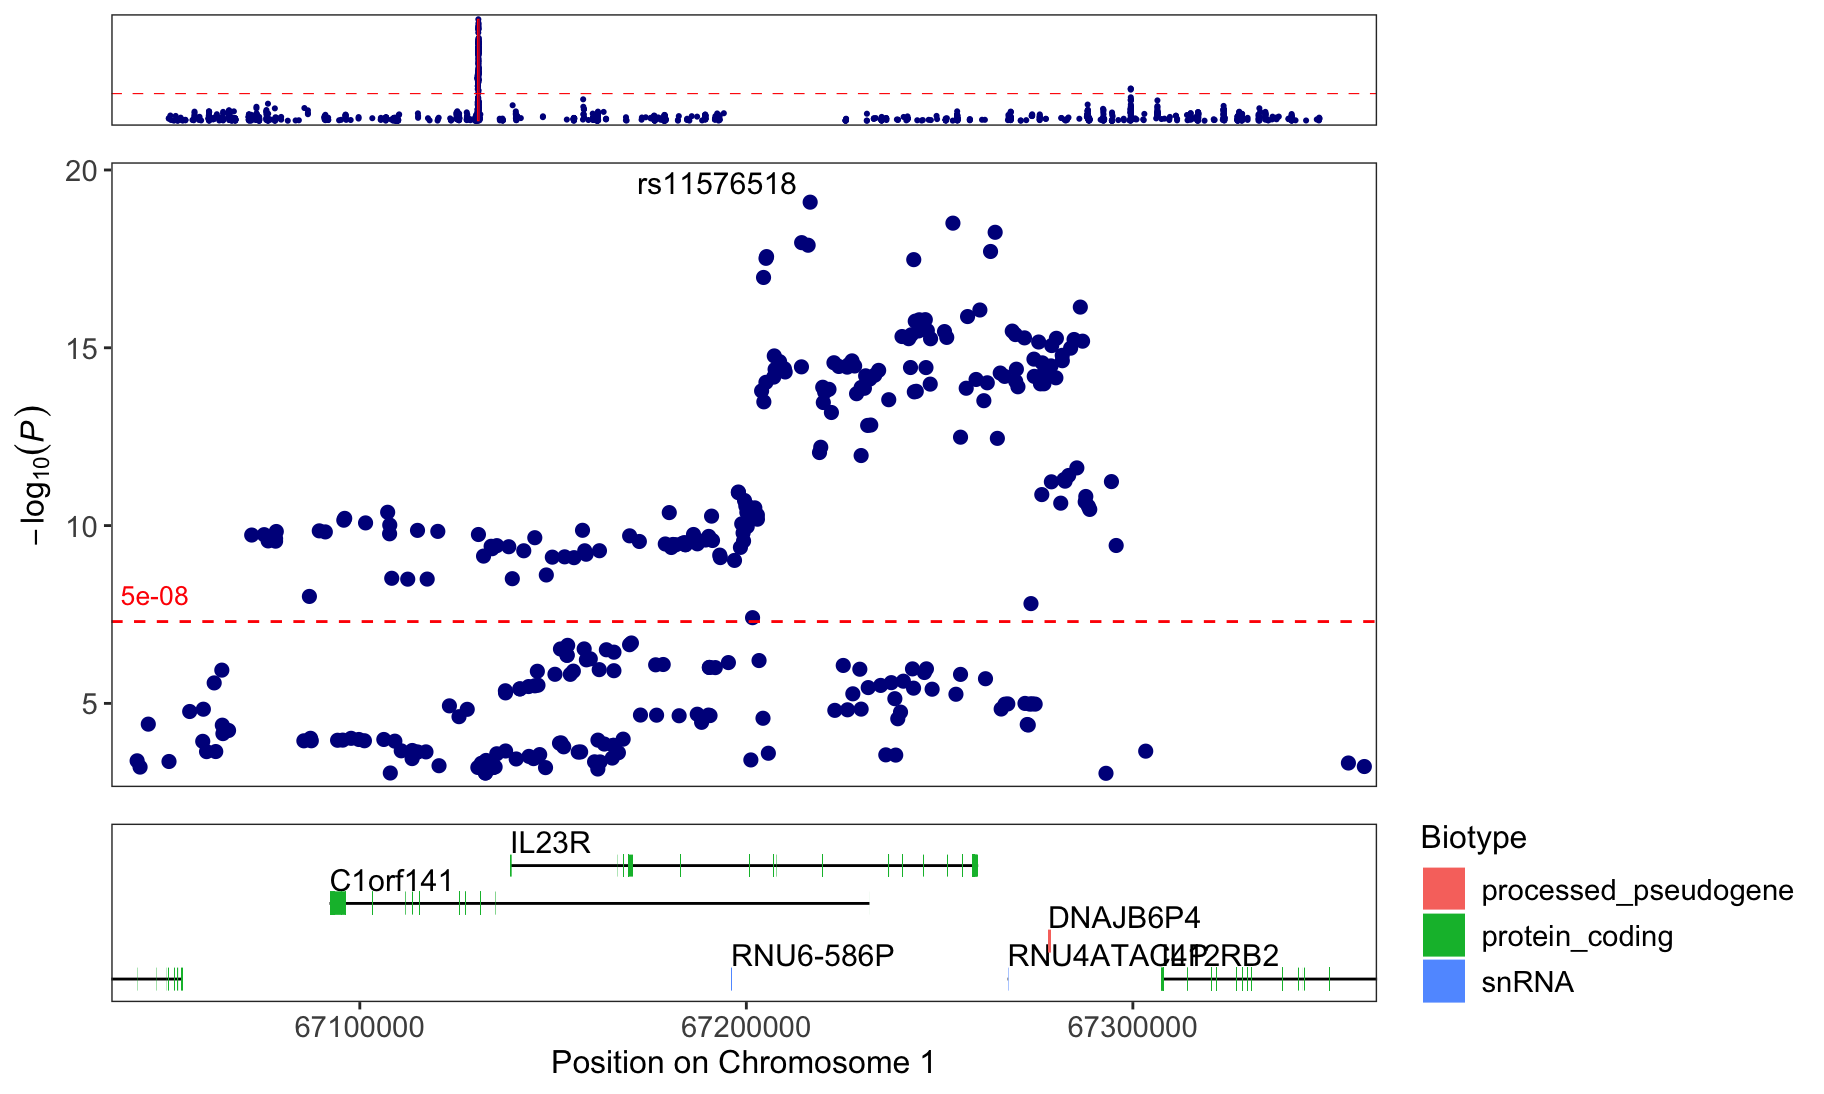
Multi GWAS
regionplot(list(CD_UKBB, CD_FINNGEN), gene="IL23R", annotate=5e-9)[1] "Use the legend_labels argument to change the legend labels from color names to meaningful labels! "
[1] "Zoomed to region: 1:67038907-67359979"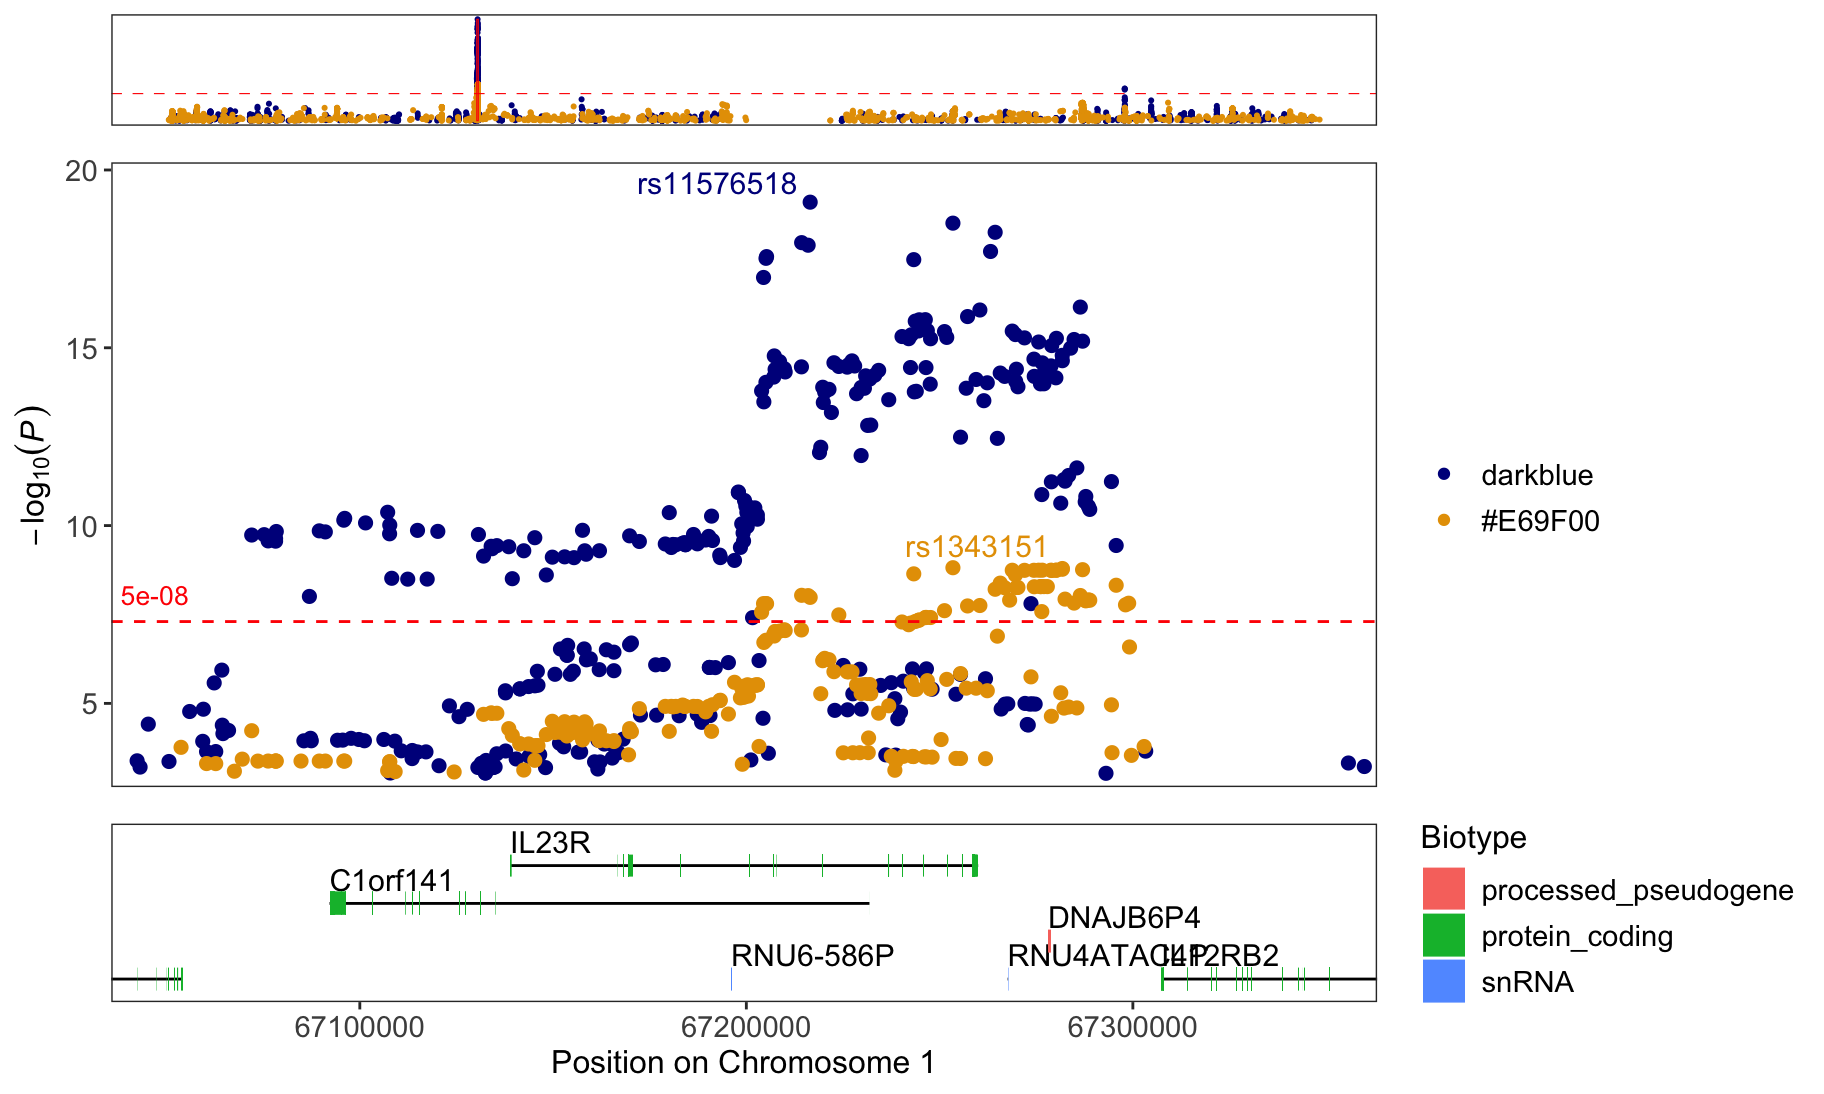
See regionplot for more examples.
locuszoom
locuszoom(R2_CD_UKBB)[1] "Zoomed to region: 1:67042284-67359988"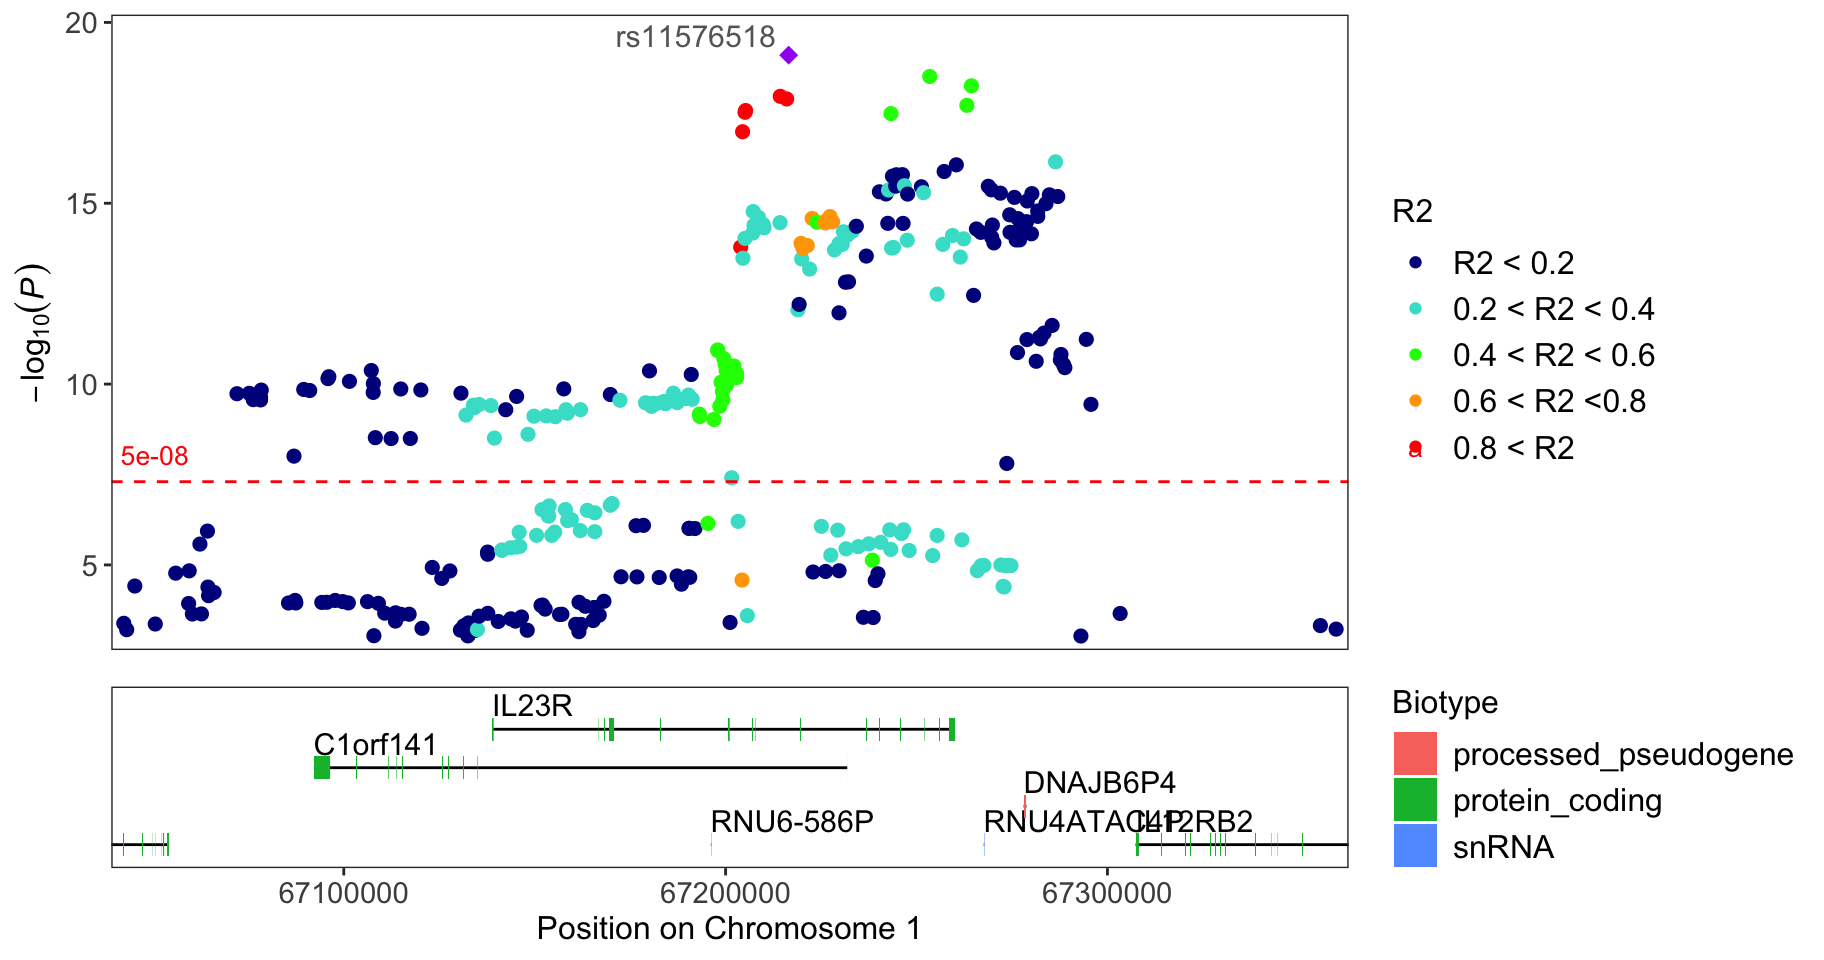
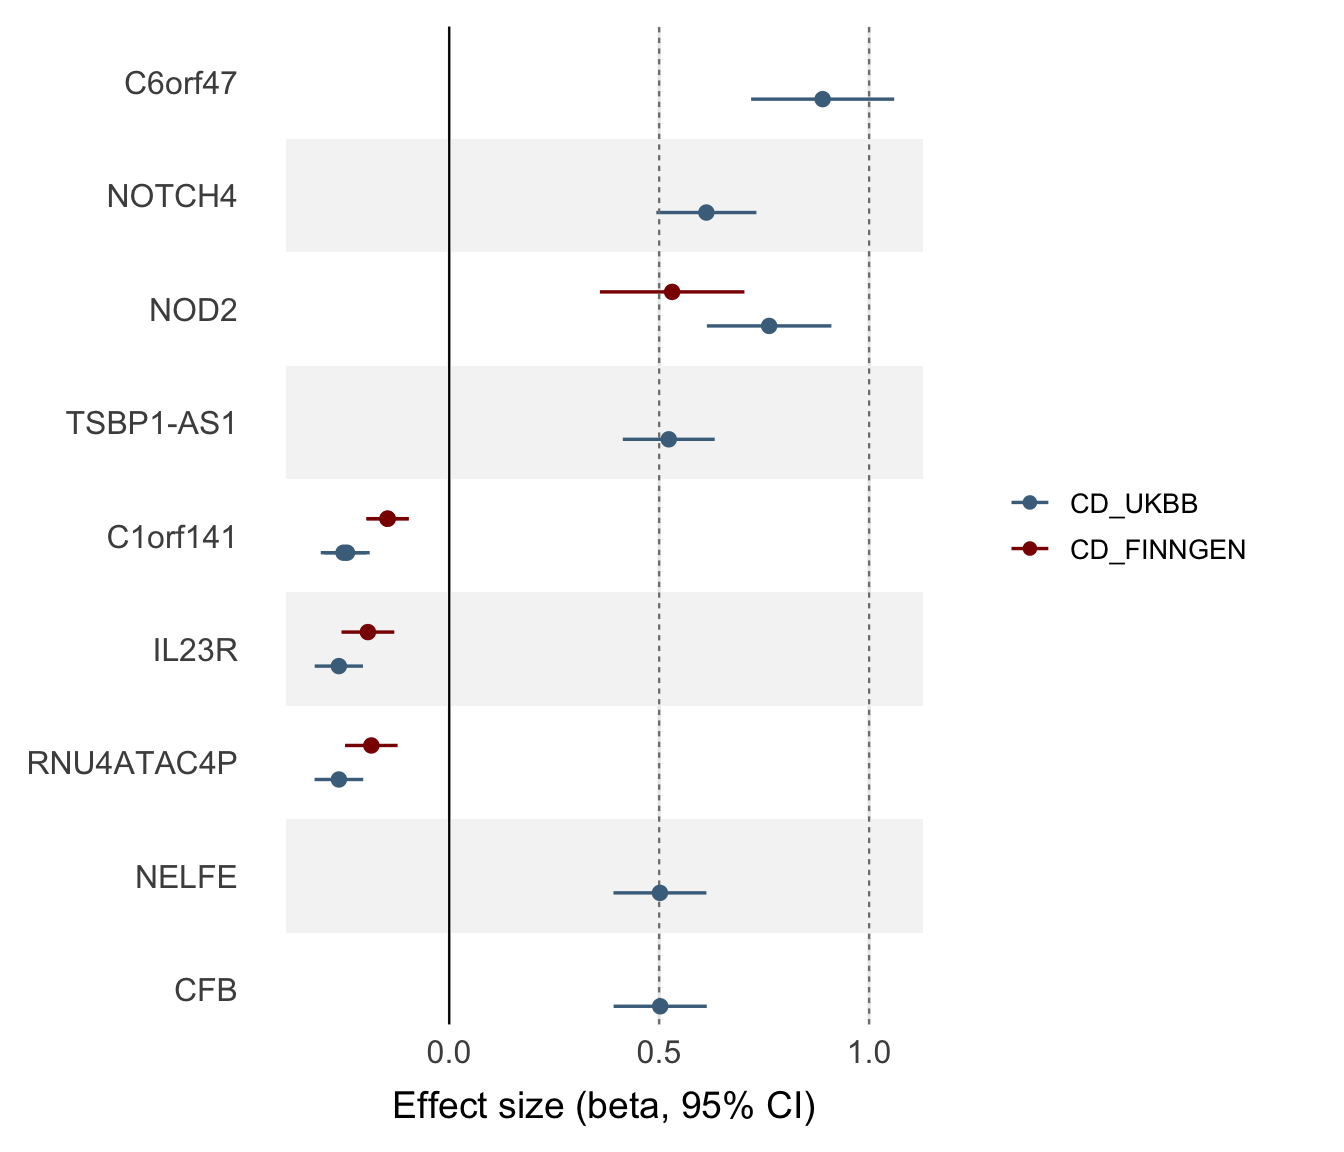
foresttopr
 primary_dat <- CD_UKBB |>
      dplyr::arrange(P) |>
      head(n = 10) |>
      annotate_with_nearest_gene()

foresttopr(
  dat = list(
    primary_dat,
    CD_FINNGEN
  ),
  key_col = "ID",
  label_col = "Gene_Symbol",
  legend_labels = c("CD_UKBB", "CD_FINNGEN"),
  effect_type = "beta"
)
See foresttopr for more examples and common use cases.
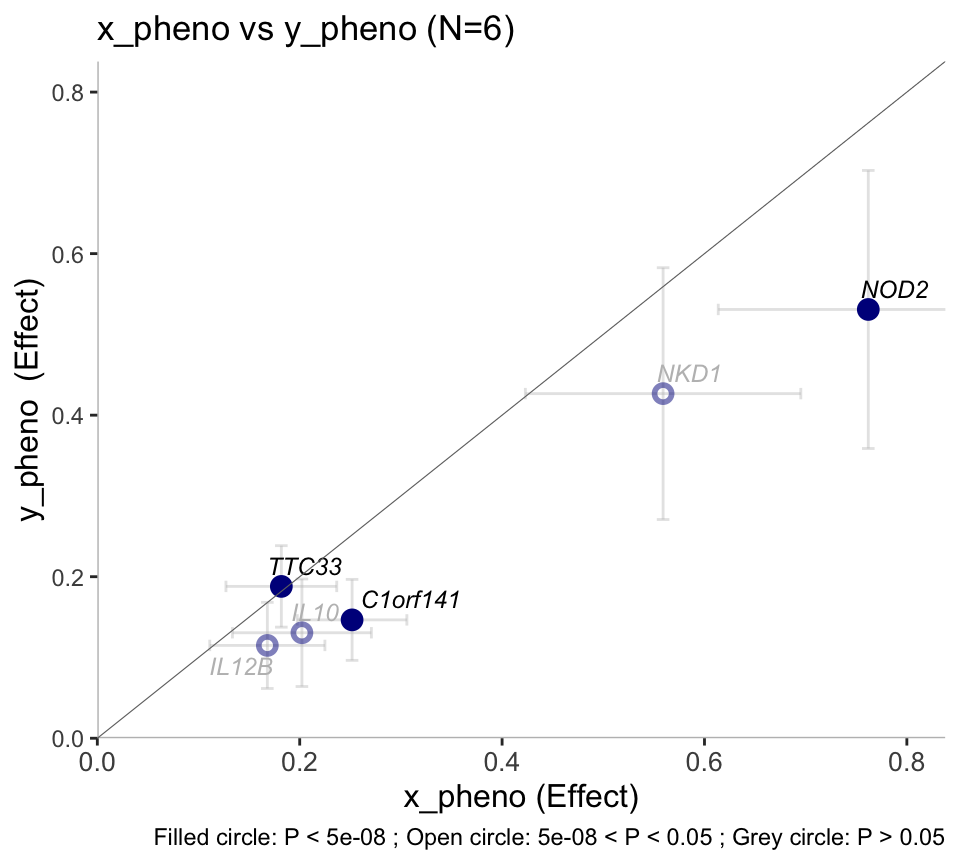
effectplot
effectplot(list(CD_UKBB, CD_FINNGEN), annotate=5e-4)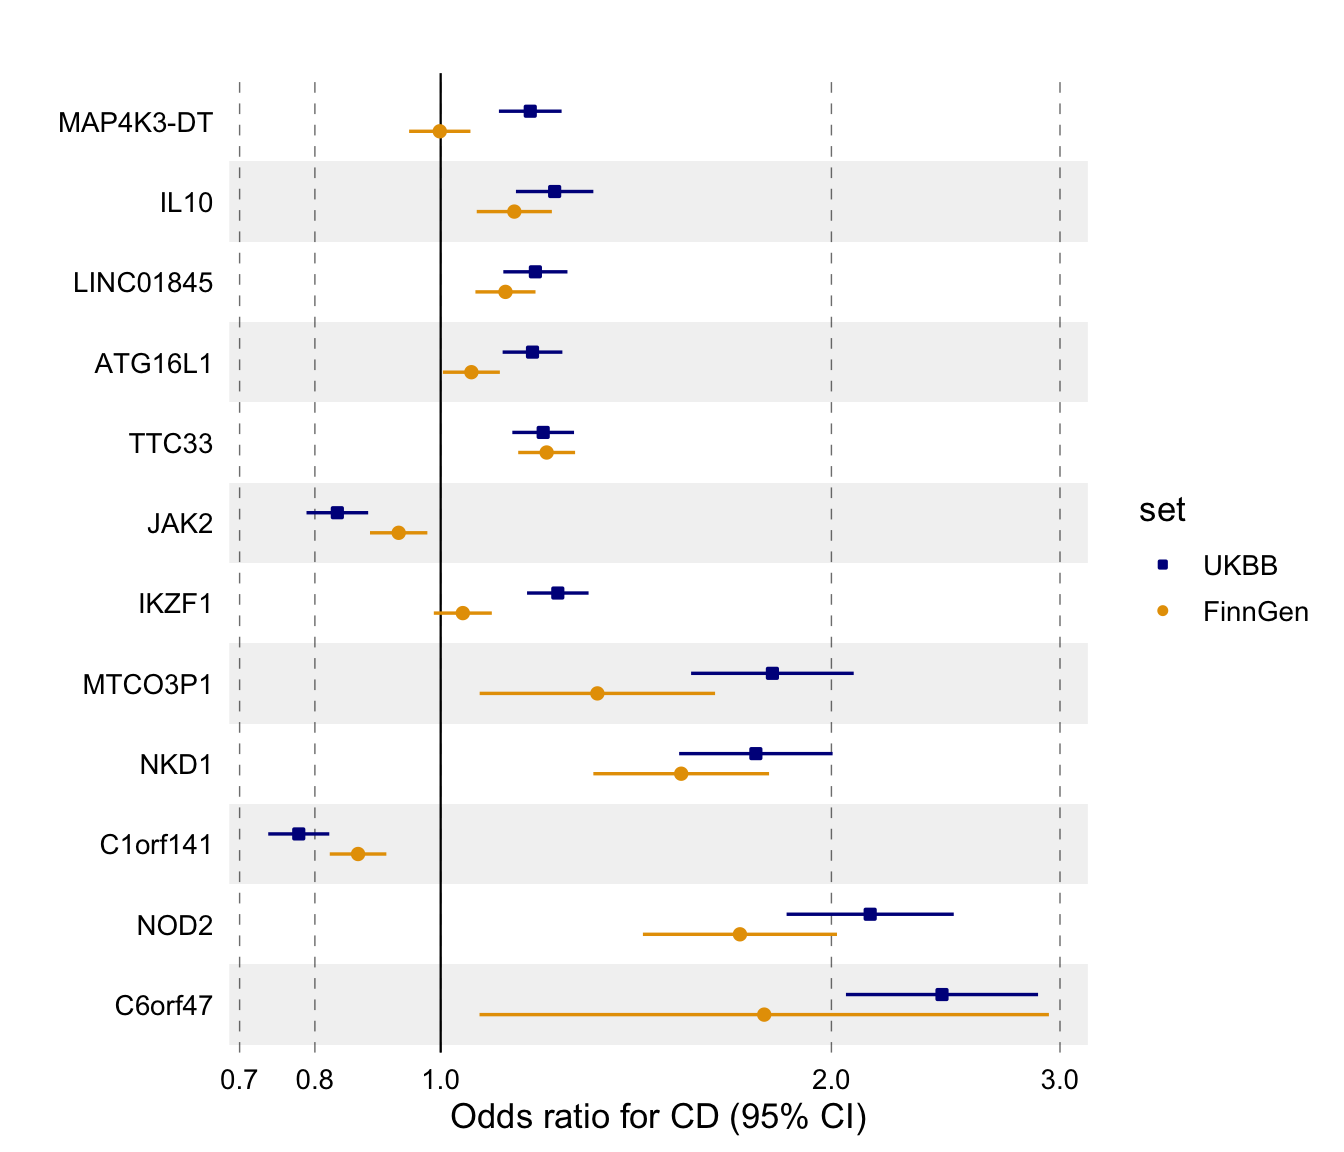
effectplot(list(CD_FINNGEN, CD_UKBB), color = get_topr_colors()[2], annotate=5e-4)