library(topr)manhattan
Single GWAS
manhattan(CD_UKBB)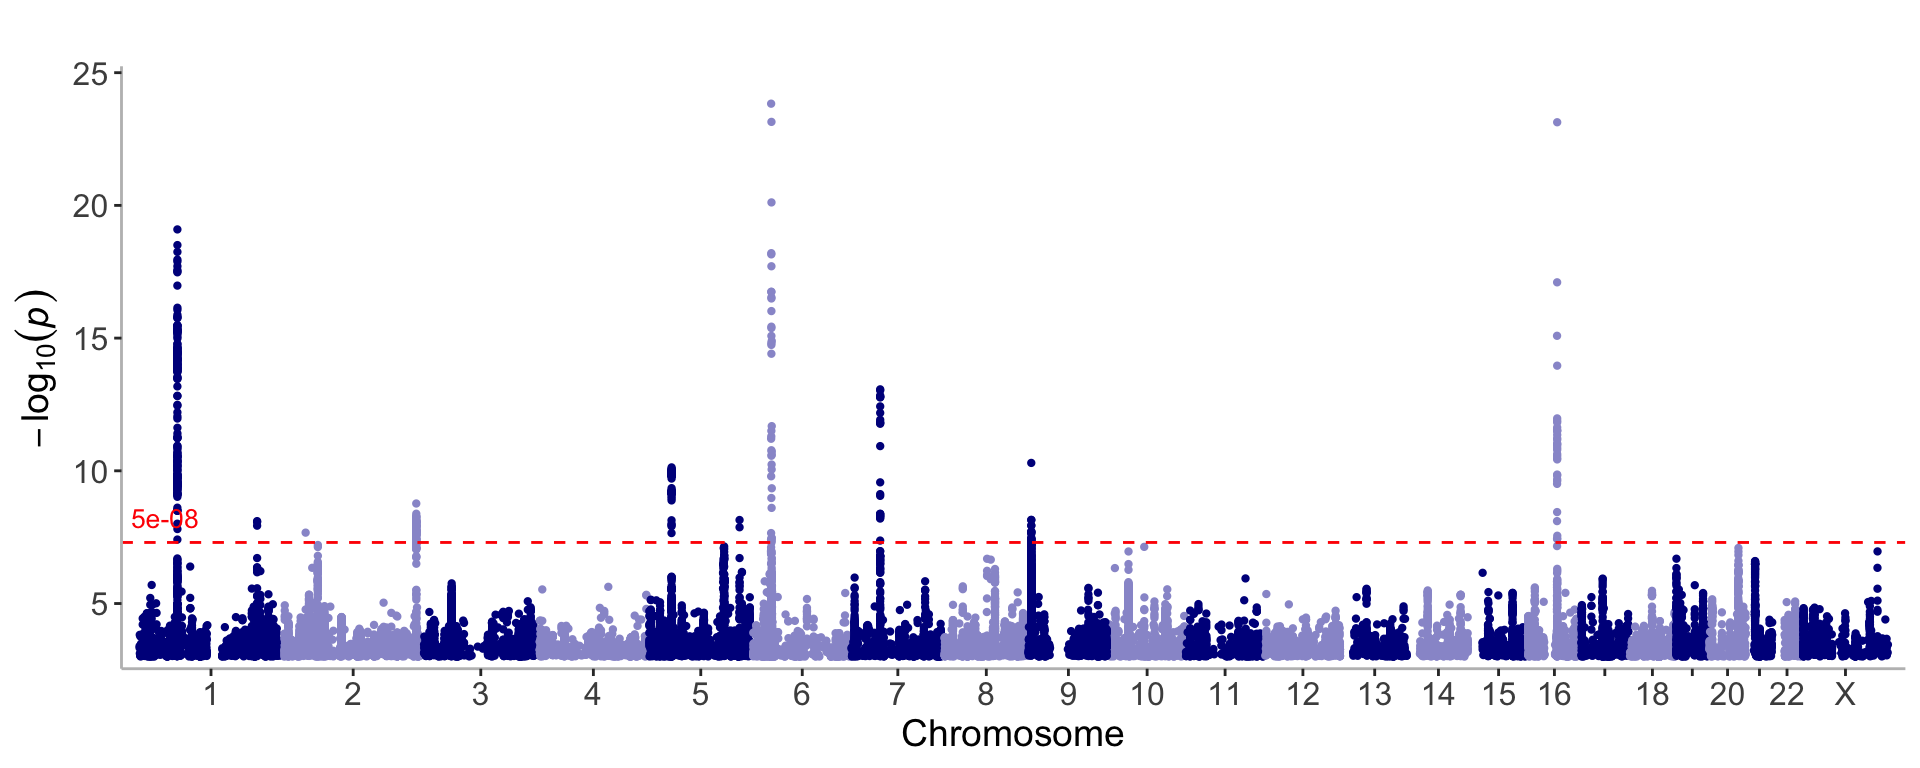
Annotate the top association peaks with the nearest gene
manhattan(CD_UKBB, annotate=5e-09)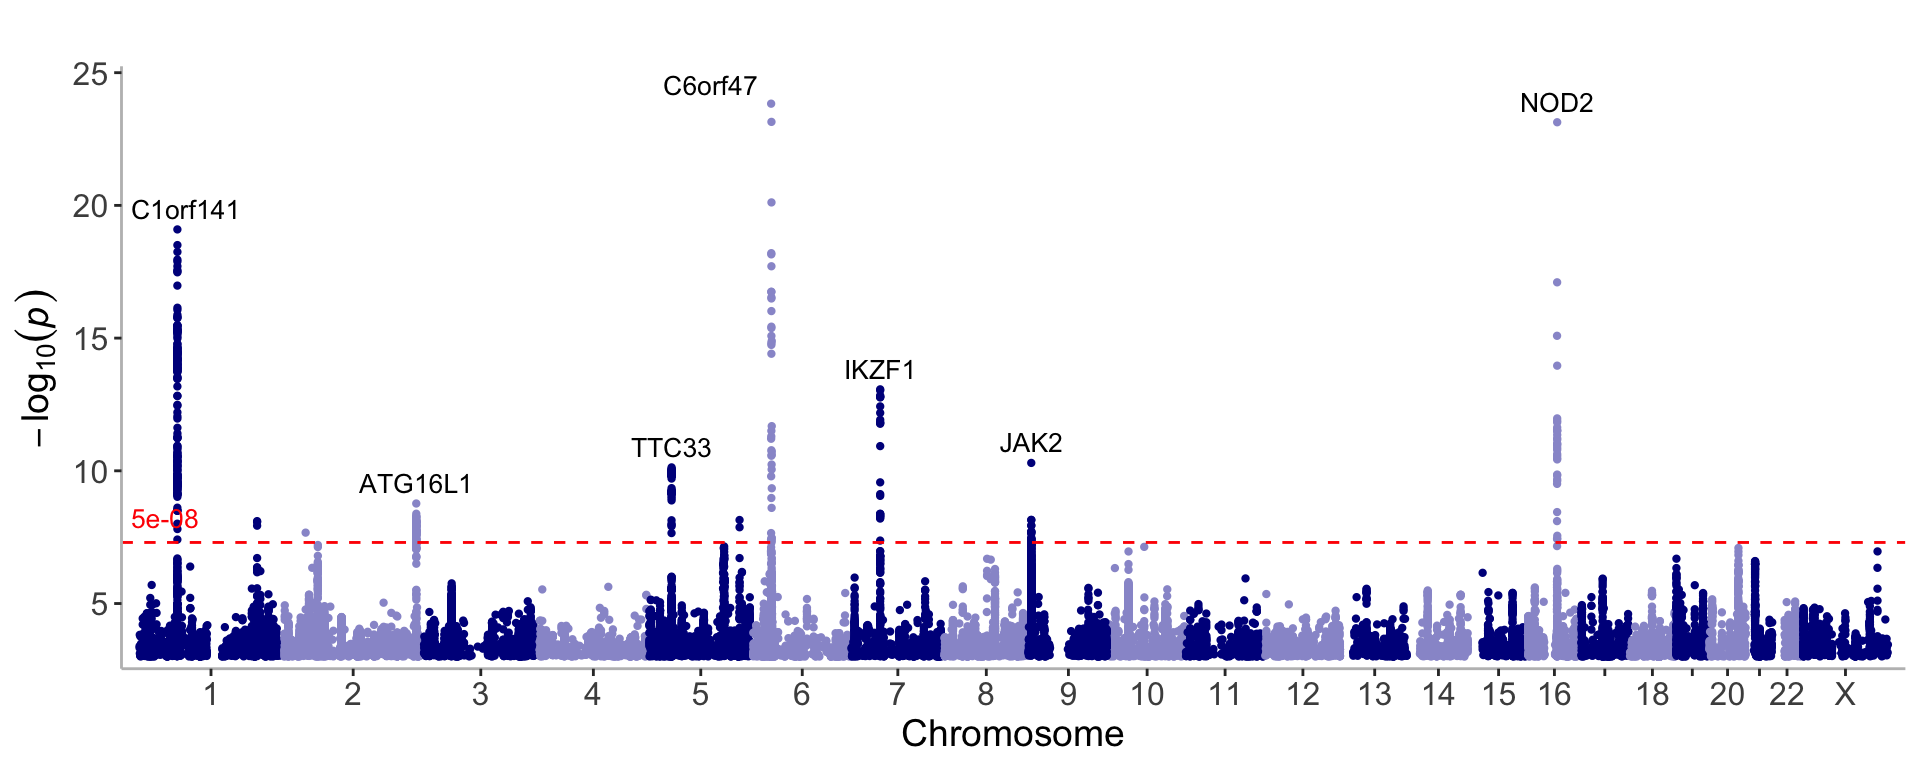
Extract the lead snps and display them in red on the manhattan plot
#Set region_size to 10000000 to only get one lead snp for peaks spanning large regions (e.g the NOD2 loci)
lead_snps <- get_lead_snps(CD_UKBB, thresh = 5e-09, region_size = 10000000)
Single GWAS with lead/index snp’s
manhattan(list(CD_UKBB, lead_snps),
          annotate=c(5e-100, 5e-09),
          color=c("darkblue","red"),
legend_labels=c("CD UKBB", "Lead snp's"), verbose=F, title="Crohn's disease") 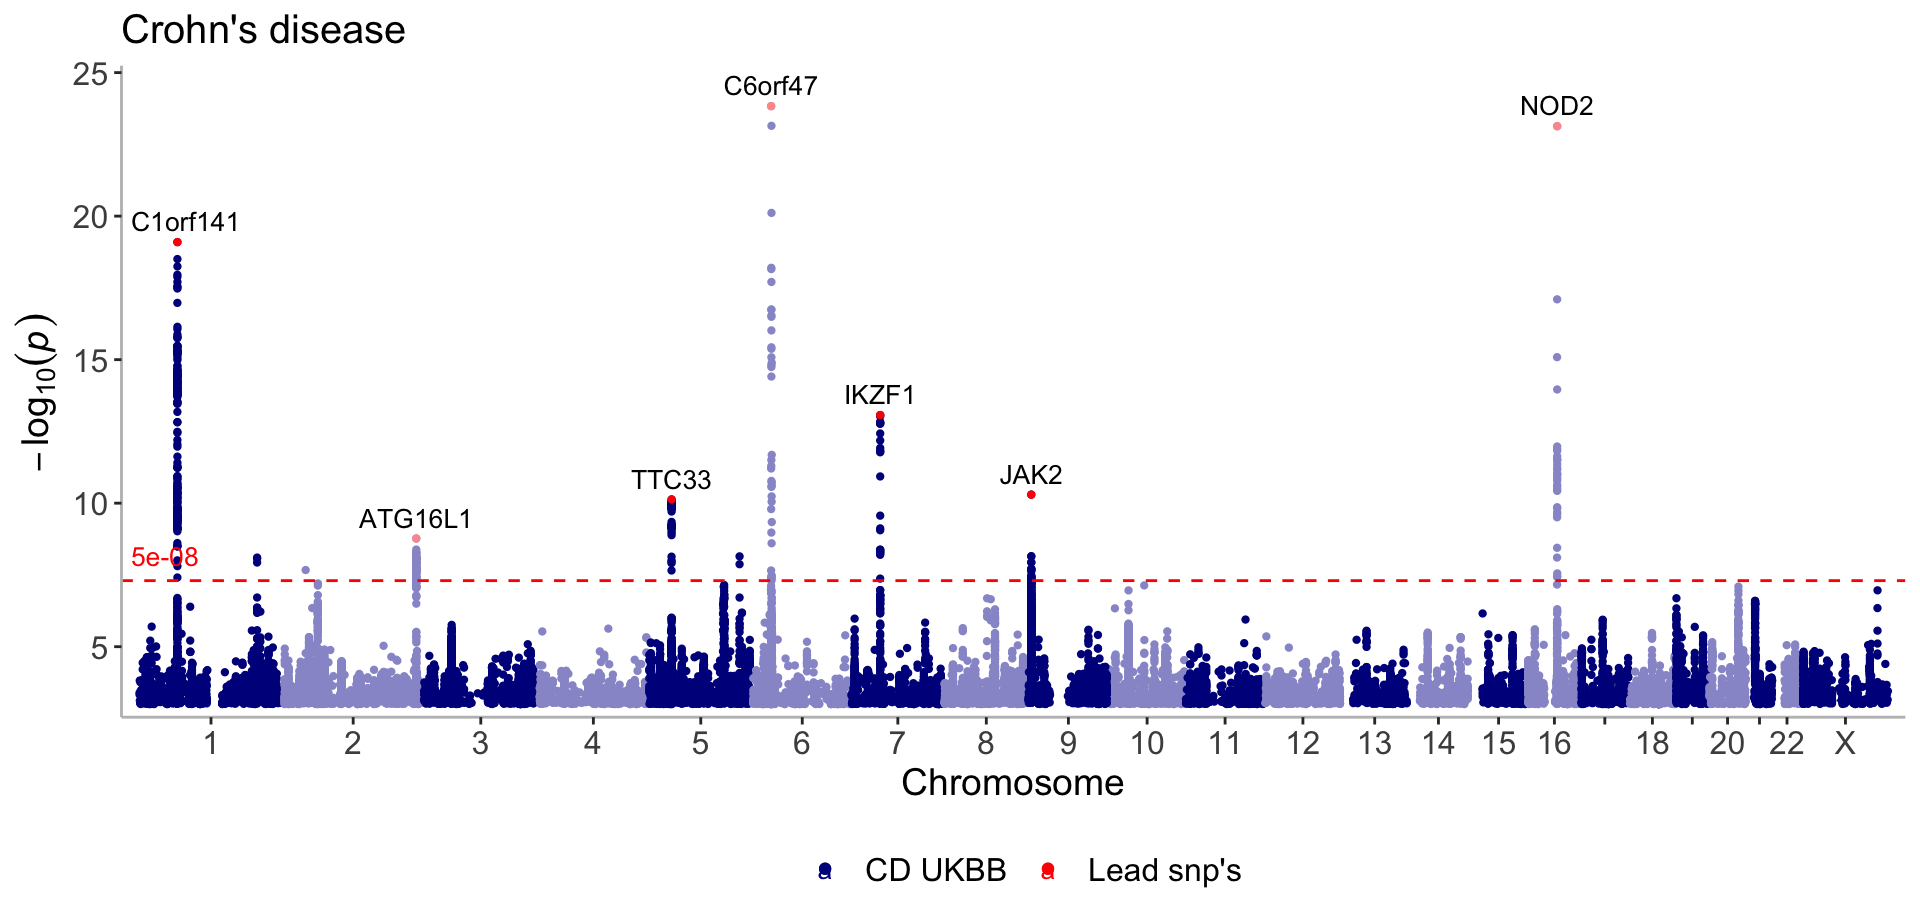
Change the annotation to vertical and italic. Reduce the size of all text by setting the scale argument to 0.9. Move the legend labels to the top.
manhattan(list(CD_UKBB, lead_snps),
          annotate=c(5e-100, 5e-09),
          color=c("darkblue","red"),
          legend_labels=c("CD UKBB", "Lead snp's"),
          size=c(1,2),
          shape=c(19,8),
          angle = 90,
          label_fontface = "italic",
          nudge_y = 5,
          scale=0.9,
          legend_position = "top",
          ymax=32,
          even_no_chr_lightness = c(0.8,0.5),
          verbose=F,
title="Crohn's disease") 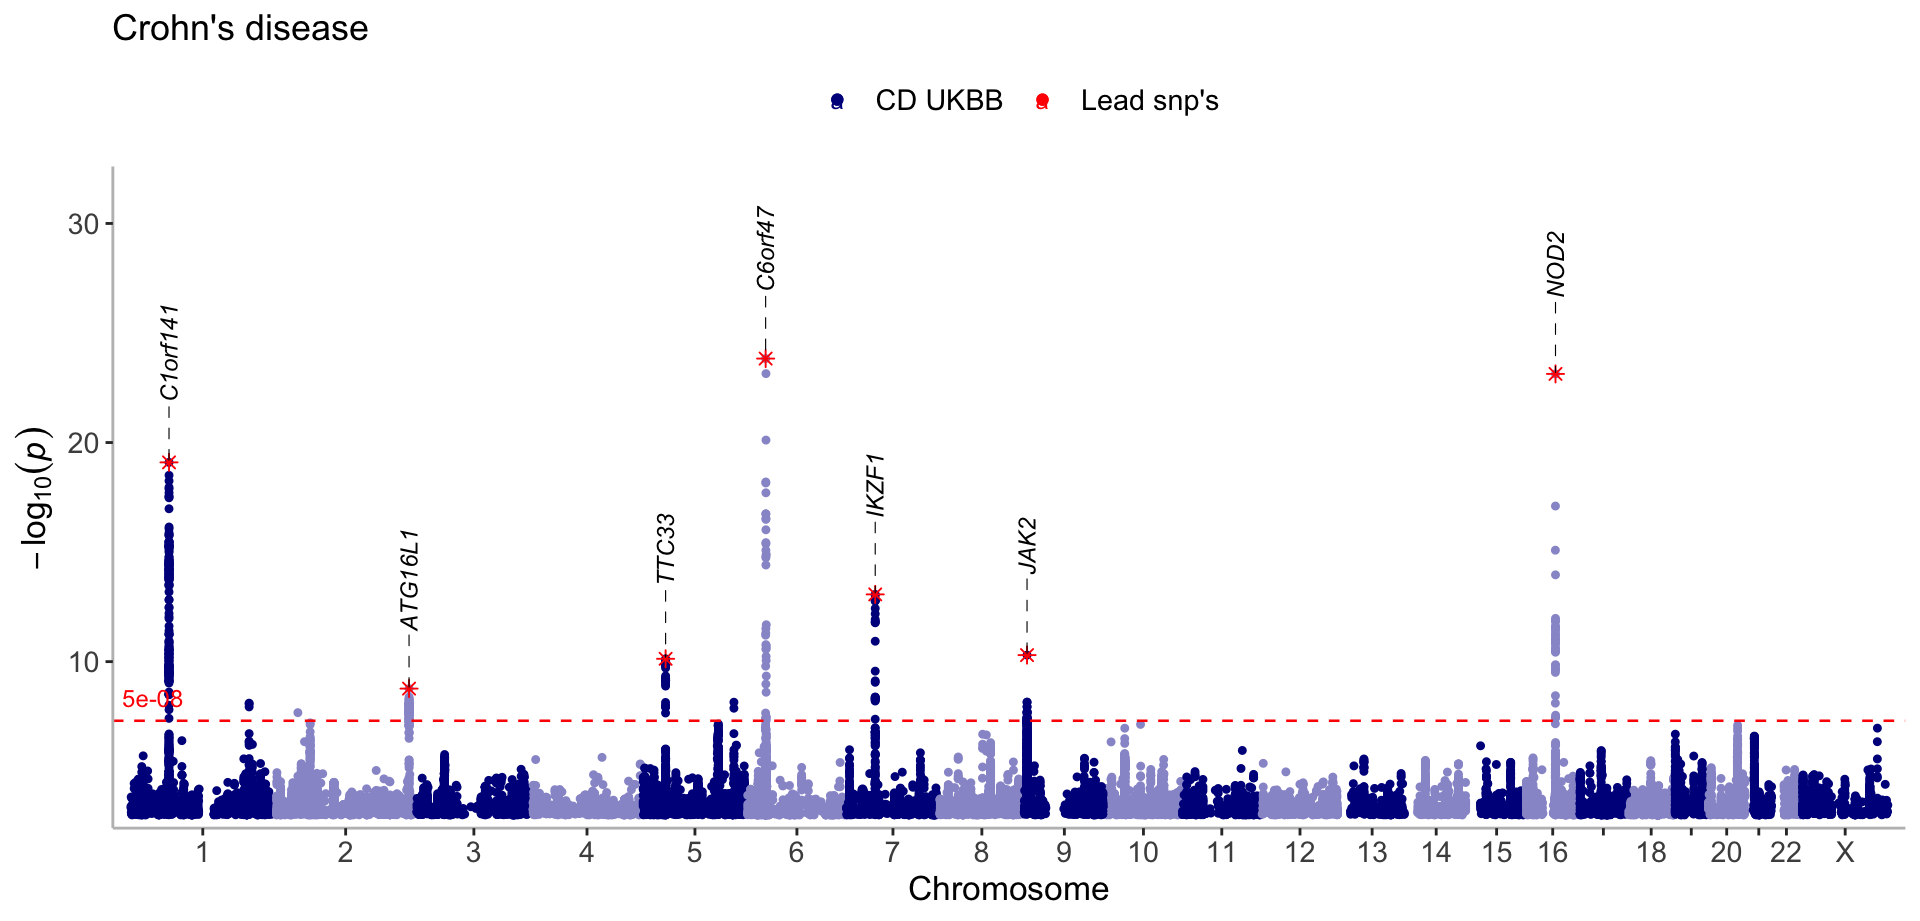
Multi GWAS
manhattan(list(CD_UKBB, CD_FINNGEN), annotate = 1e-12, legend_labels=c("Crohn's (ukb)", "Crohn's (FinnGen)"), title="Inflammatory Bowel Disease")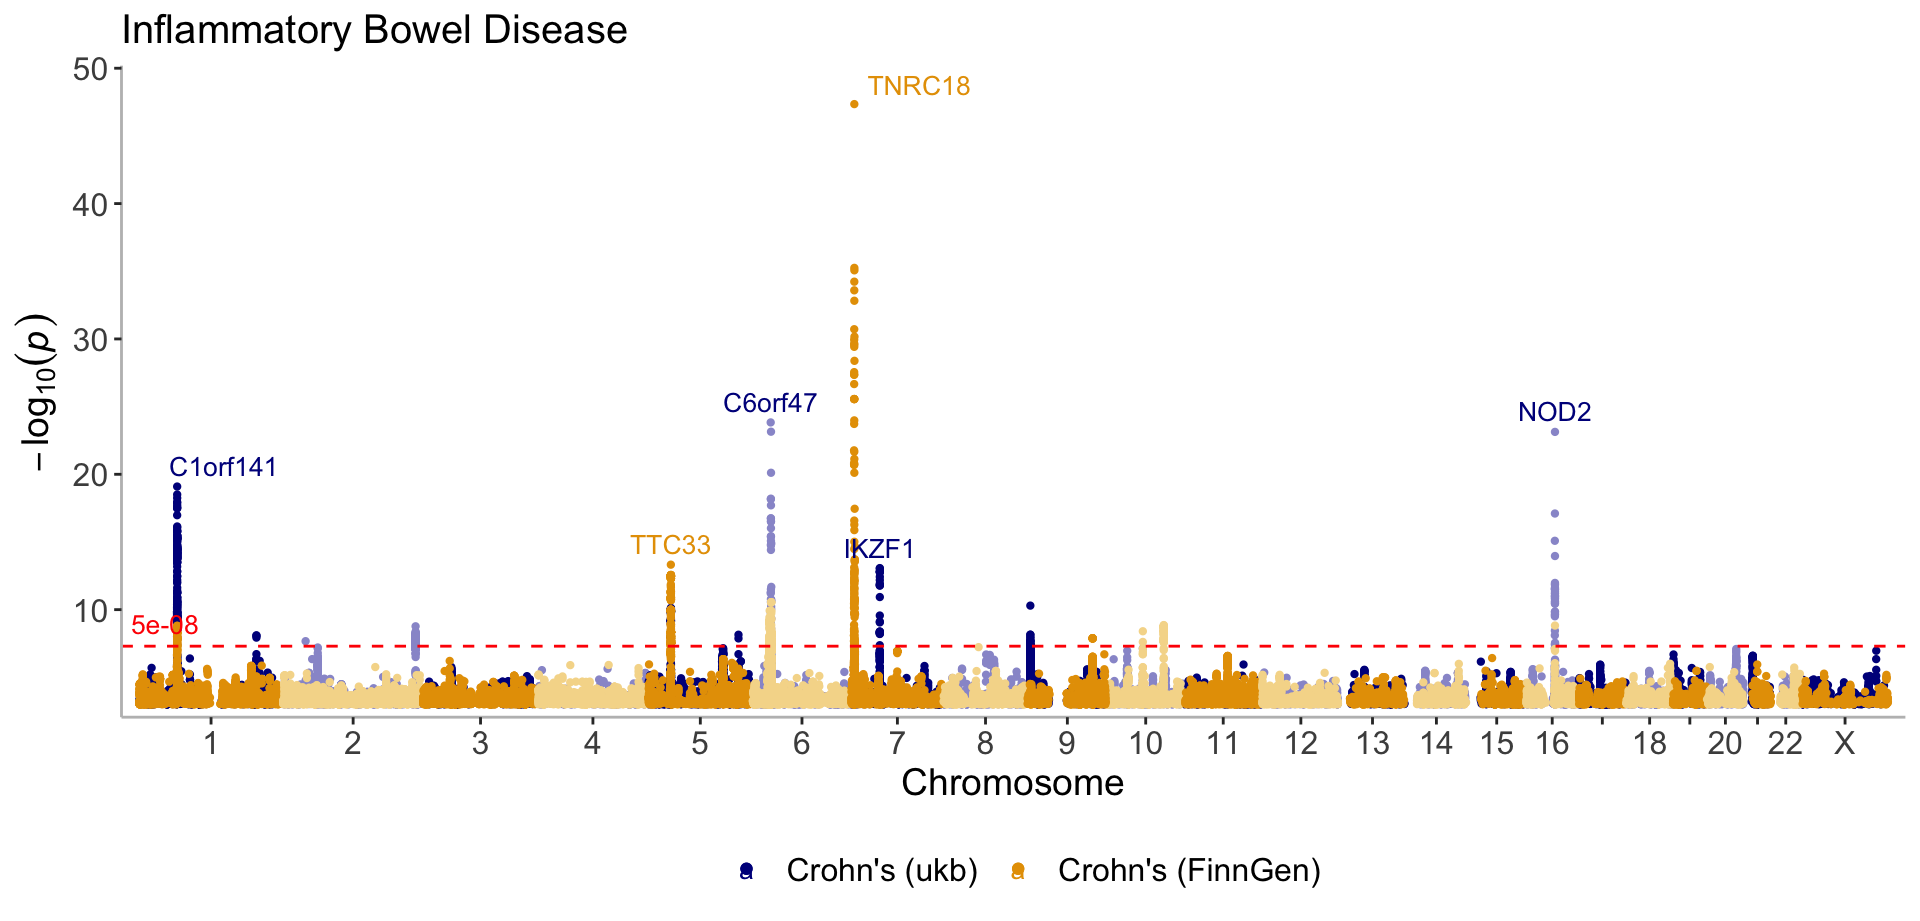
manhattan(list(CD_UKBB, CD_FINNGEN), annotate = 1e-9, legend_labels=c("Crohn's (ukb)", "Crohn's (FinnGen)"), ntop=1, title="Inflammatory Bowel Disease")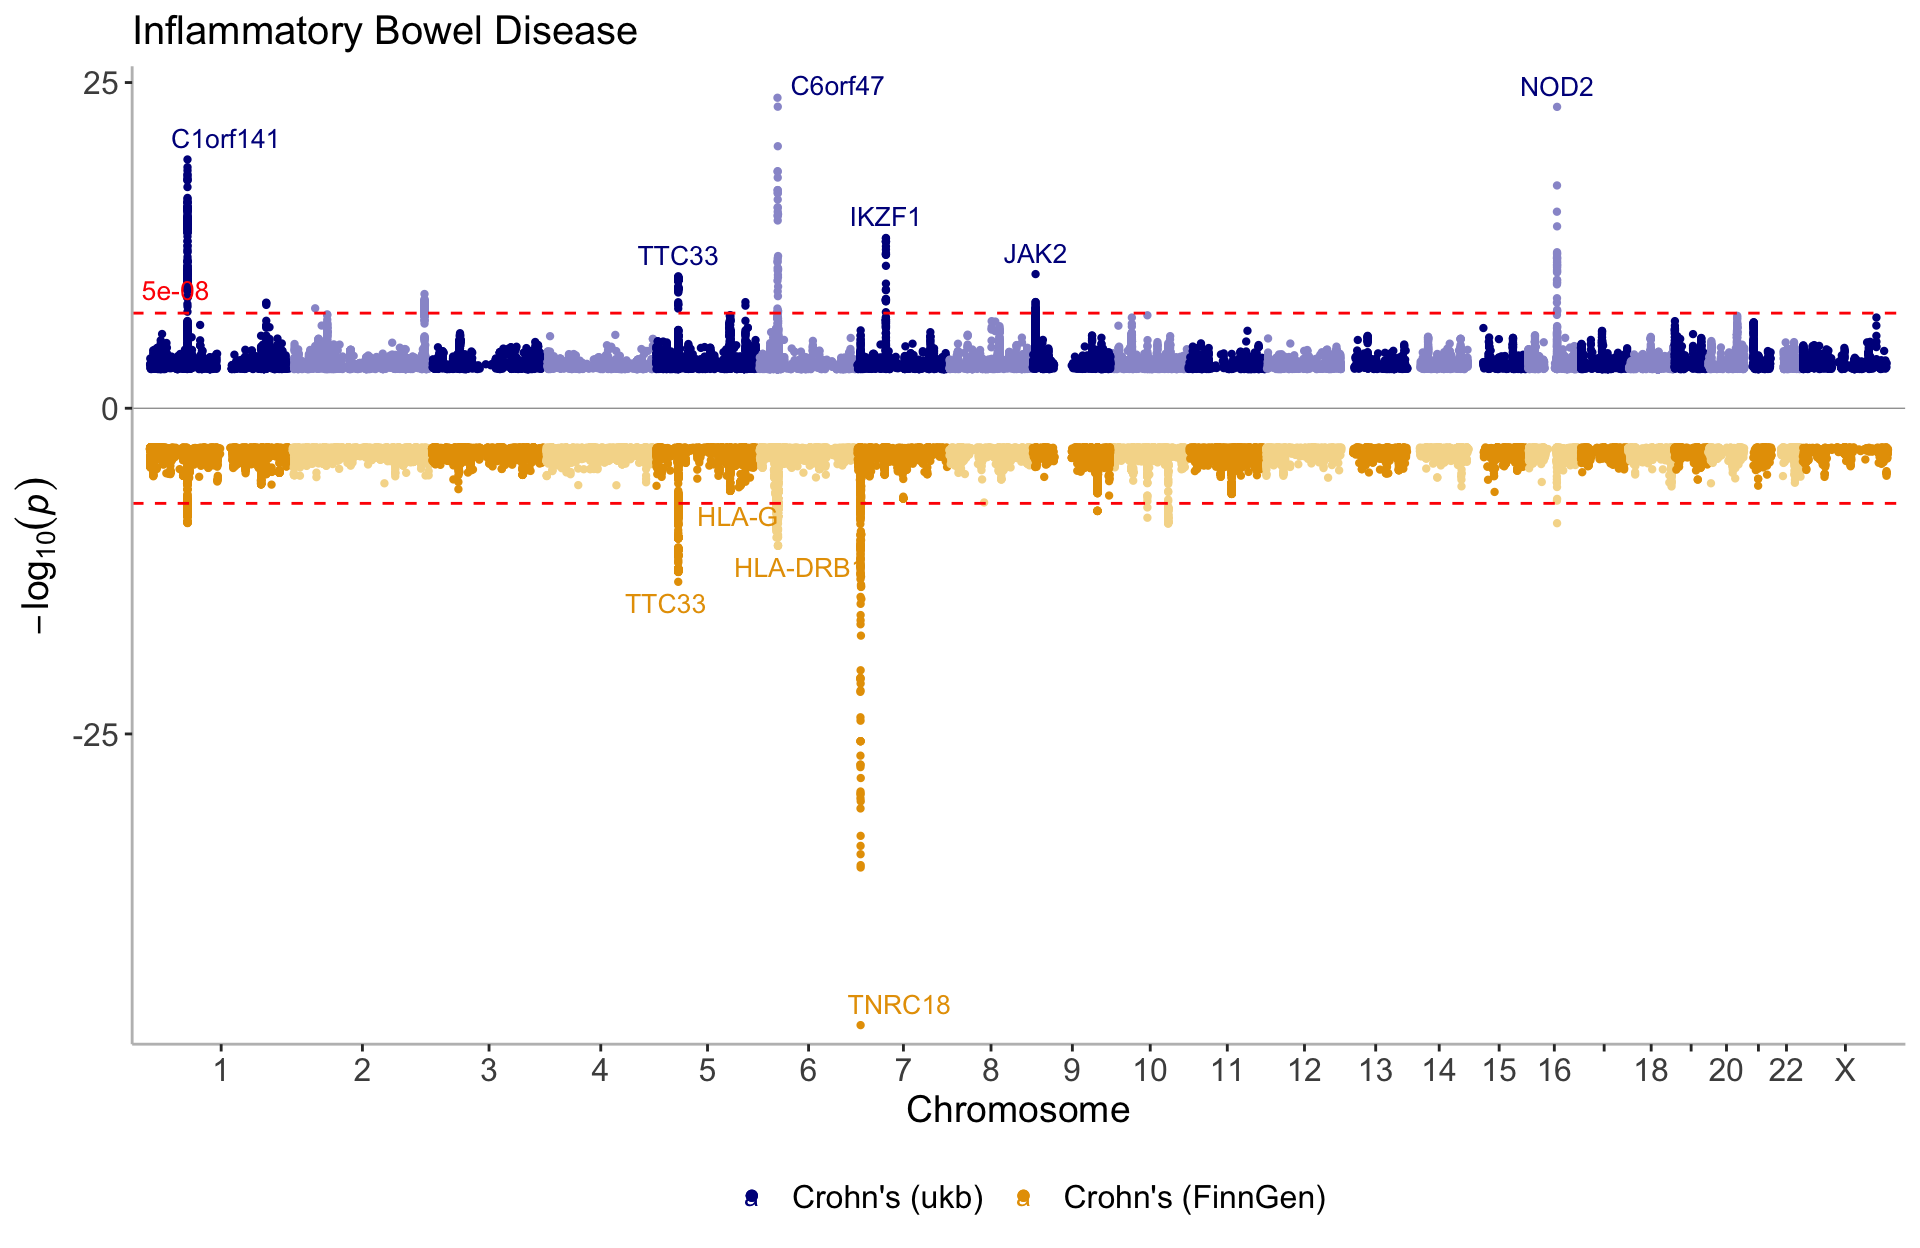
manhattan(list(CD_UKBB, CD_FINNGEN, UC_UKBB),
          annotate = 1e-15,
          legend_labels=c("Crohn's (ukb)", "Crohn's (FinnGen)", "Colitis Ulcerosa (ukb)"),
          ntop=2,
          color = c("#f47c3c","darkred","#464646"),
          sign_thresh_color = "darkred",
          ymin=-38,
          title="Inflammatory Bowel Disease")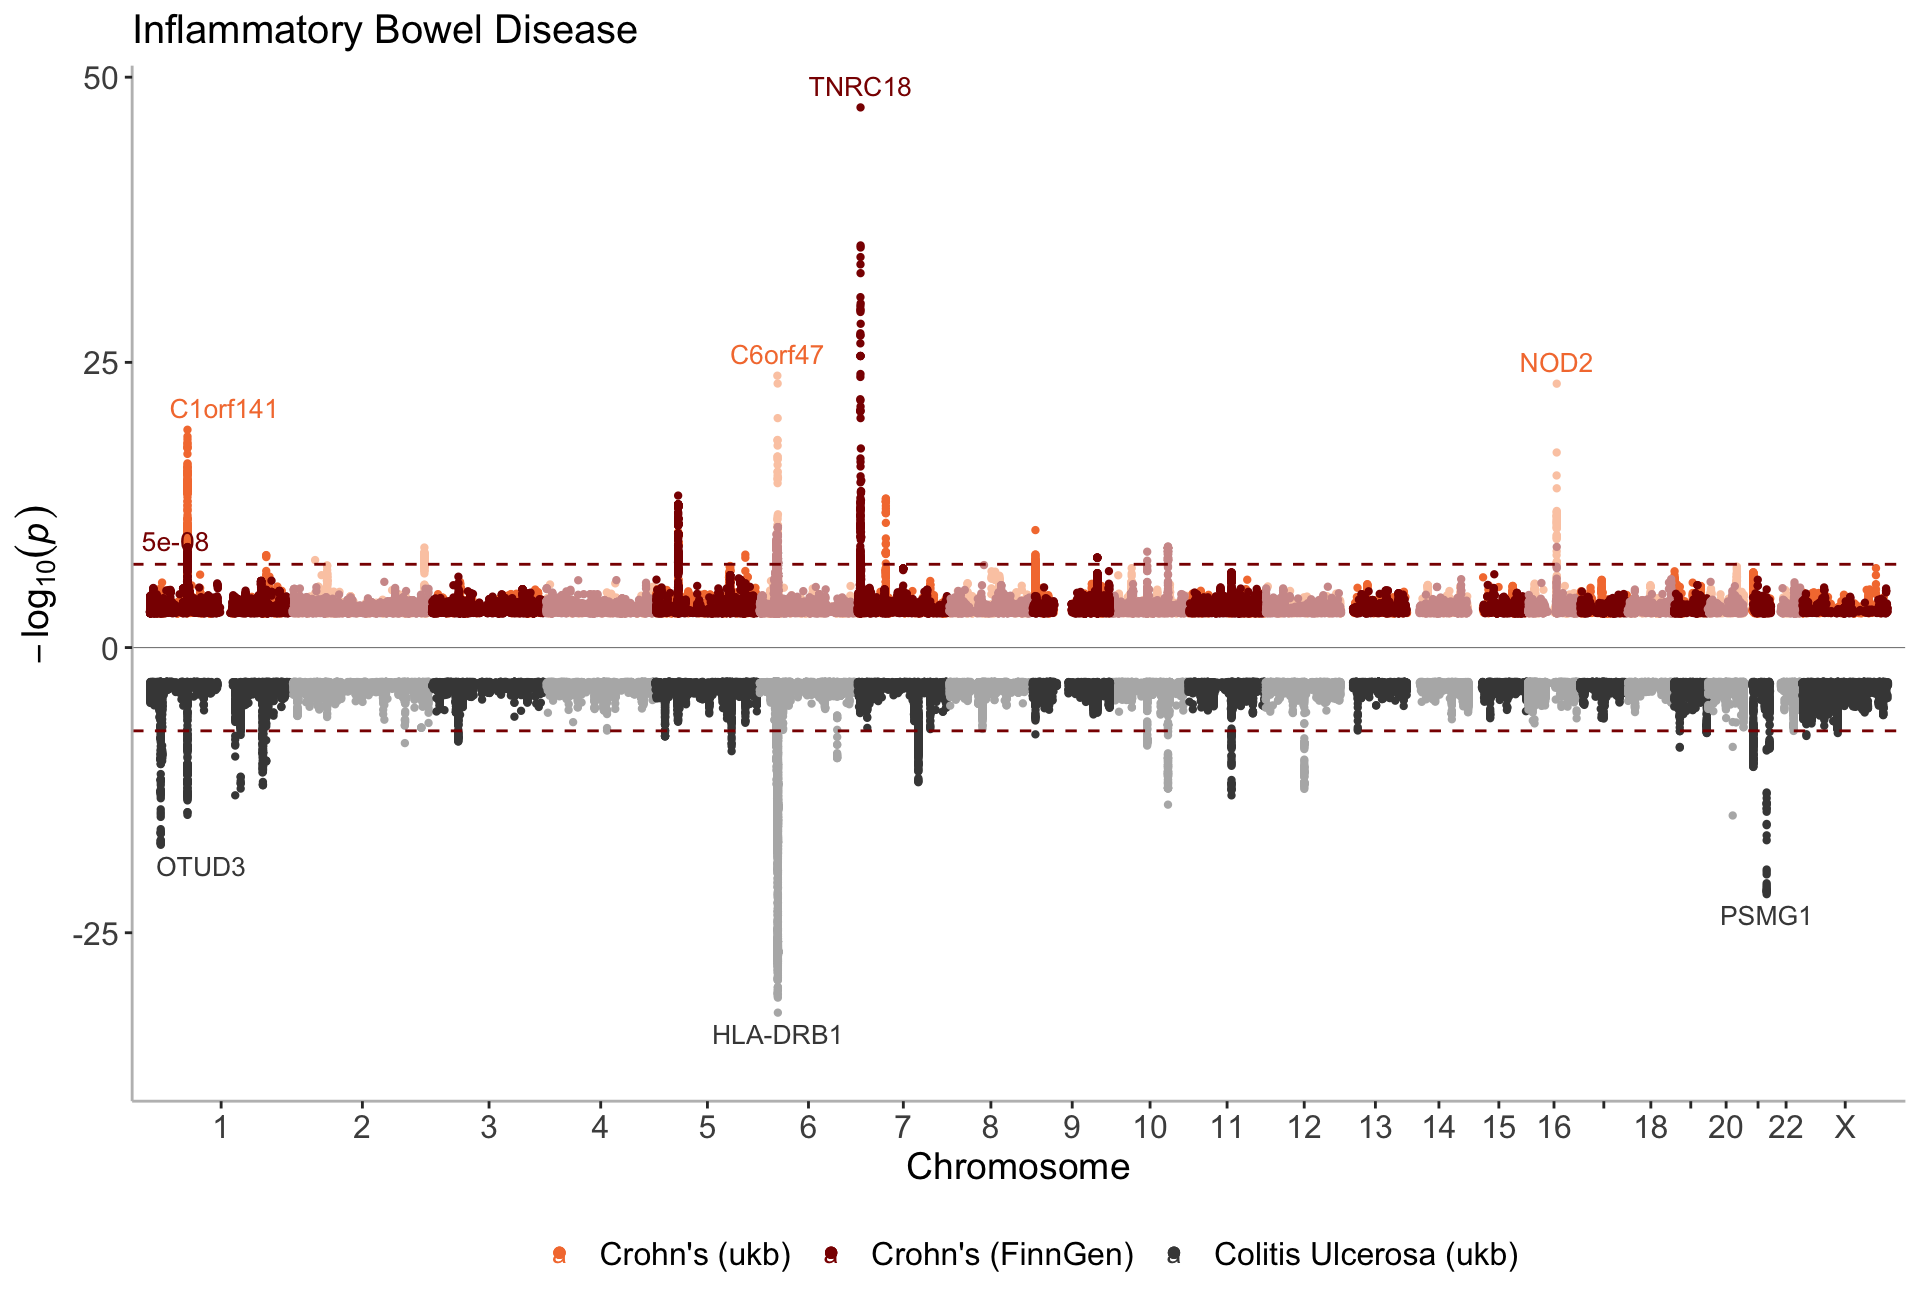
Highlight known and novel loci
Single GWAS
#create dataframes for hypothetically known and novel loci
CD_UKBB_annotated <- CD_UKBB %>% filter(P<5e-09) %>%annotate_with_nearest_gene()
known_UKB <- CD_UKBB_annotated %>% filter(Gene_Symbol %in% c("C1orf141","IL23R","NOD2","NKD1","CYLD","IKZF1"))
novel_UKB <- CD_UKBB_annotated %>% filter(Gene_Symbol %in% c("JAK2","TTC33","ATG16L1"))manhattan(list(CD_UKBB, known_UKB, novel_UKB),
color=c("#A0A0A0","blue","red"),
legend_labels=c("UKBB","known","novel"),
annotate = c(1e-50,5e-08,5e-08),
even_no_chr_lightness = c(0.8,0.5,0.5),
sign_thresh = 5e-09,
verbose=F) 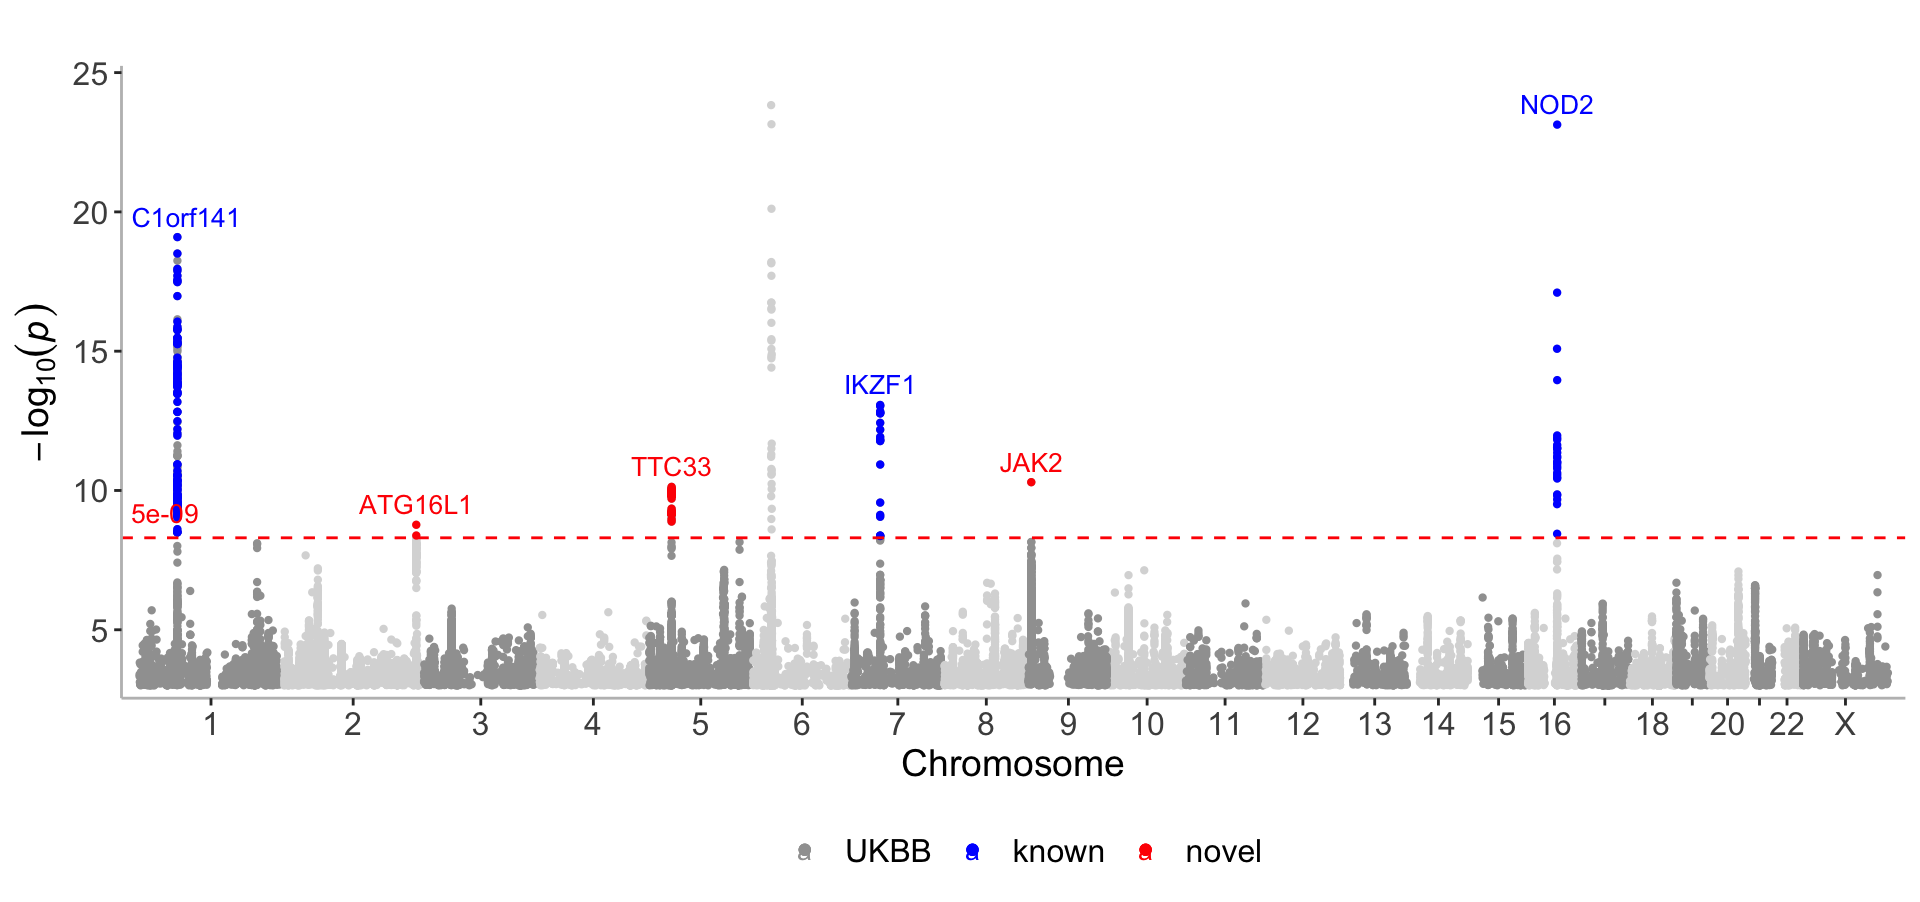
Multi GWAS
CD_FINNGEN_annotated <- CD_FINNGEN %>% filter(P<5e-09) %>% annotate_with_nearest_gene()
known_FG <- CD_FINNGEN_annotated %>% filter(Gene_Symbol %in% c("TNRC18","FBXL18","RNF216","WIPI2", "RNU6-215P", "IL23R","NOD2"))
novel_FG <- CD_FINNGEN_annotated %>% filter(Gene_Symbol %in% c("ADO","TTC33","NKX2-3"))manhattan(list(CD_UKBB, known_UKB, novel_UKB, CD_FINNGEN %>% filter(P>1e-35), known_FG,novel_FG), ntop=3,
color=c("#A0A0A0","blue","red","#A5A5A5","blue","red"),
legend_labels=c("UKBB","known","novel","FinnGen", "known","novel"),
highlight_genes = c("IL23R","TTC33","NOD2"), highlight_genes_ypos = -0.5,
highlight_genes_color = "green",
annotate = c(1e-50,5e-08,5e-08,1e-50,5e-08,5e-08),
angle=90,nudge_y=7, ymax=33, ymin=-43,
even_no_chr_lightness = c(0.8,0.5,0.5,0.8,0.5,0.5),
title="Crohn's UKBB vs Crohn's Finngen",
sign_thresh = 5e-09,
verbose=F) 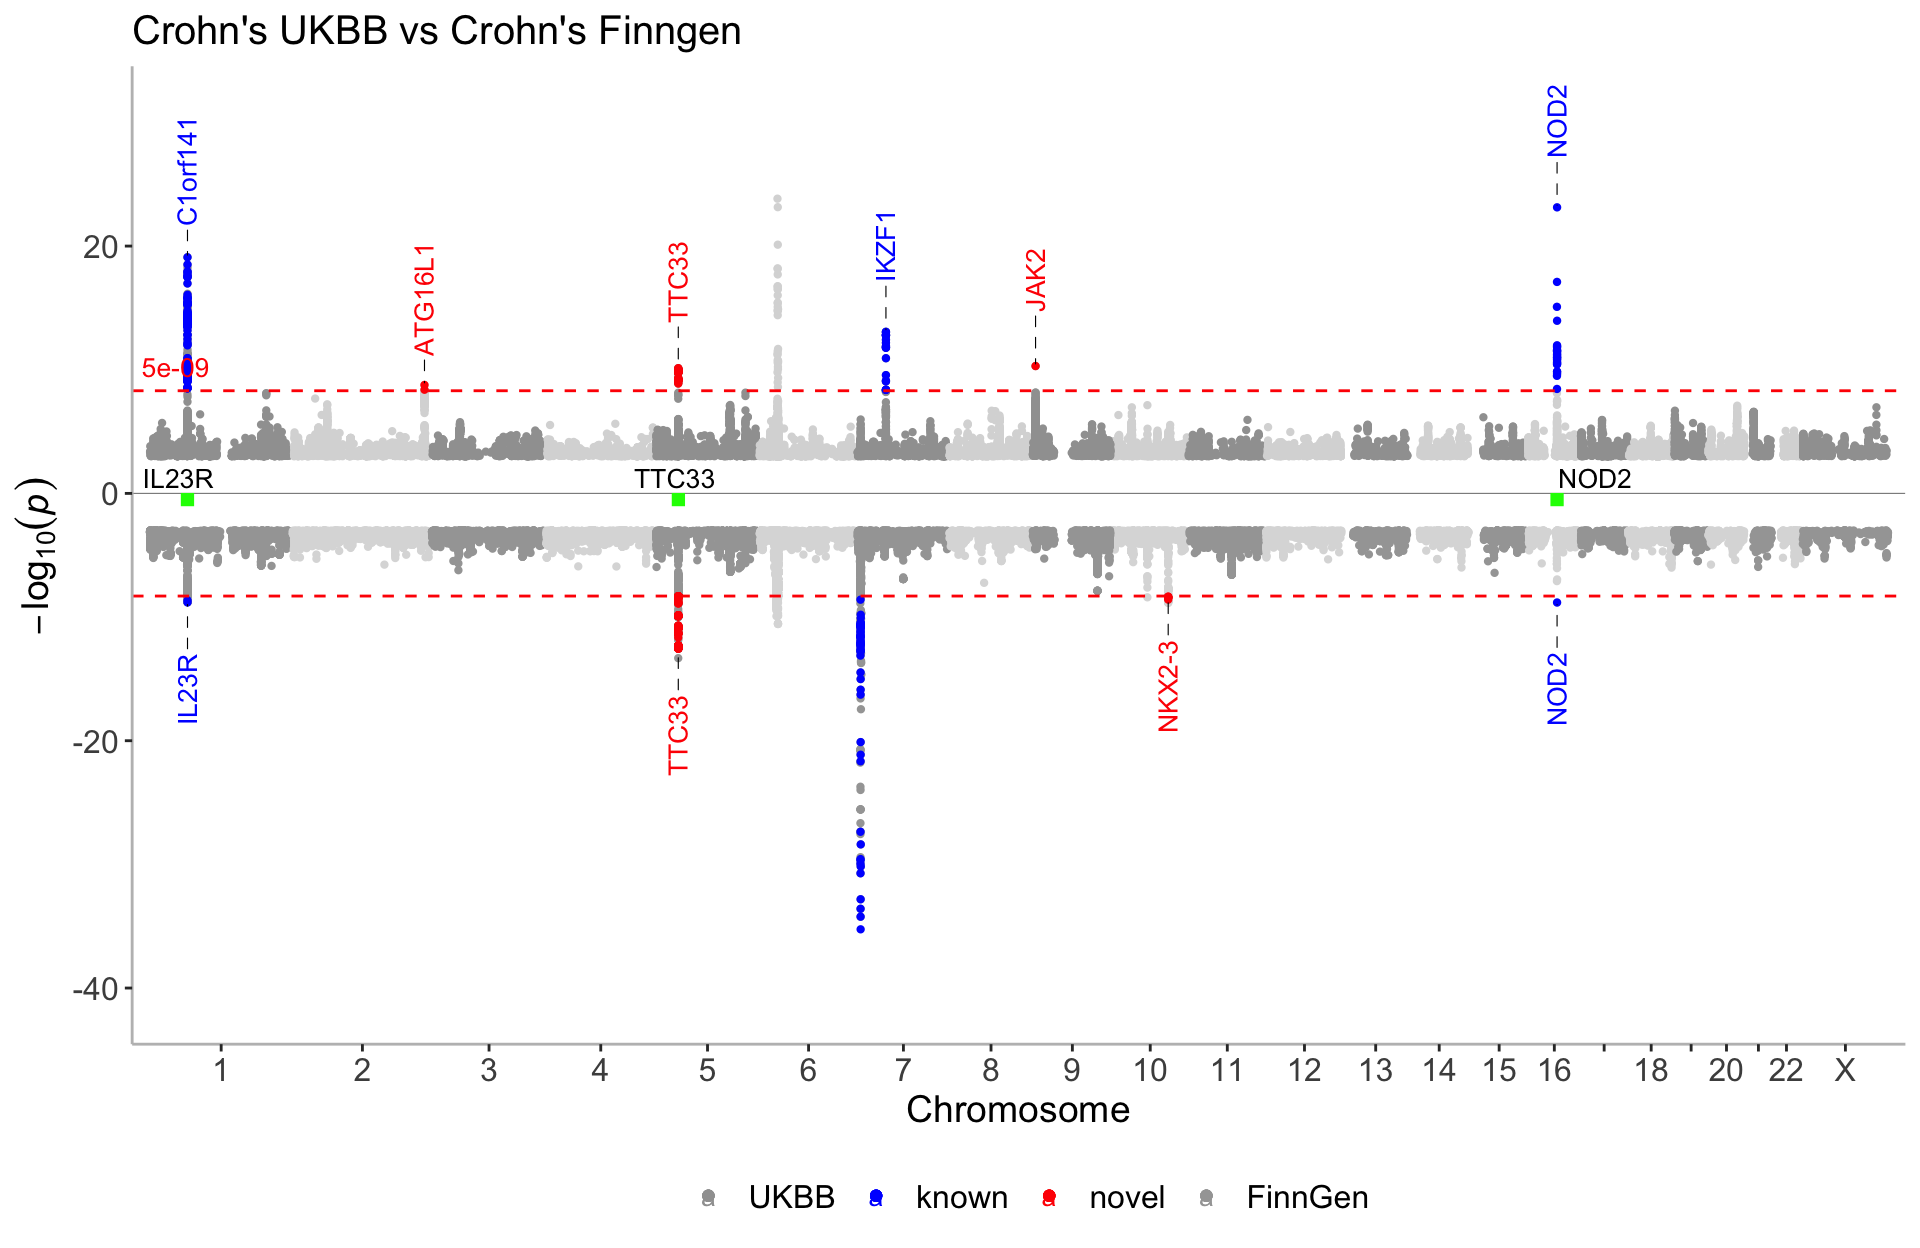
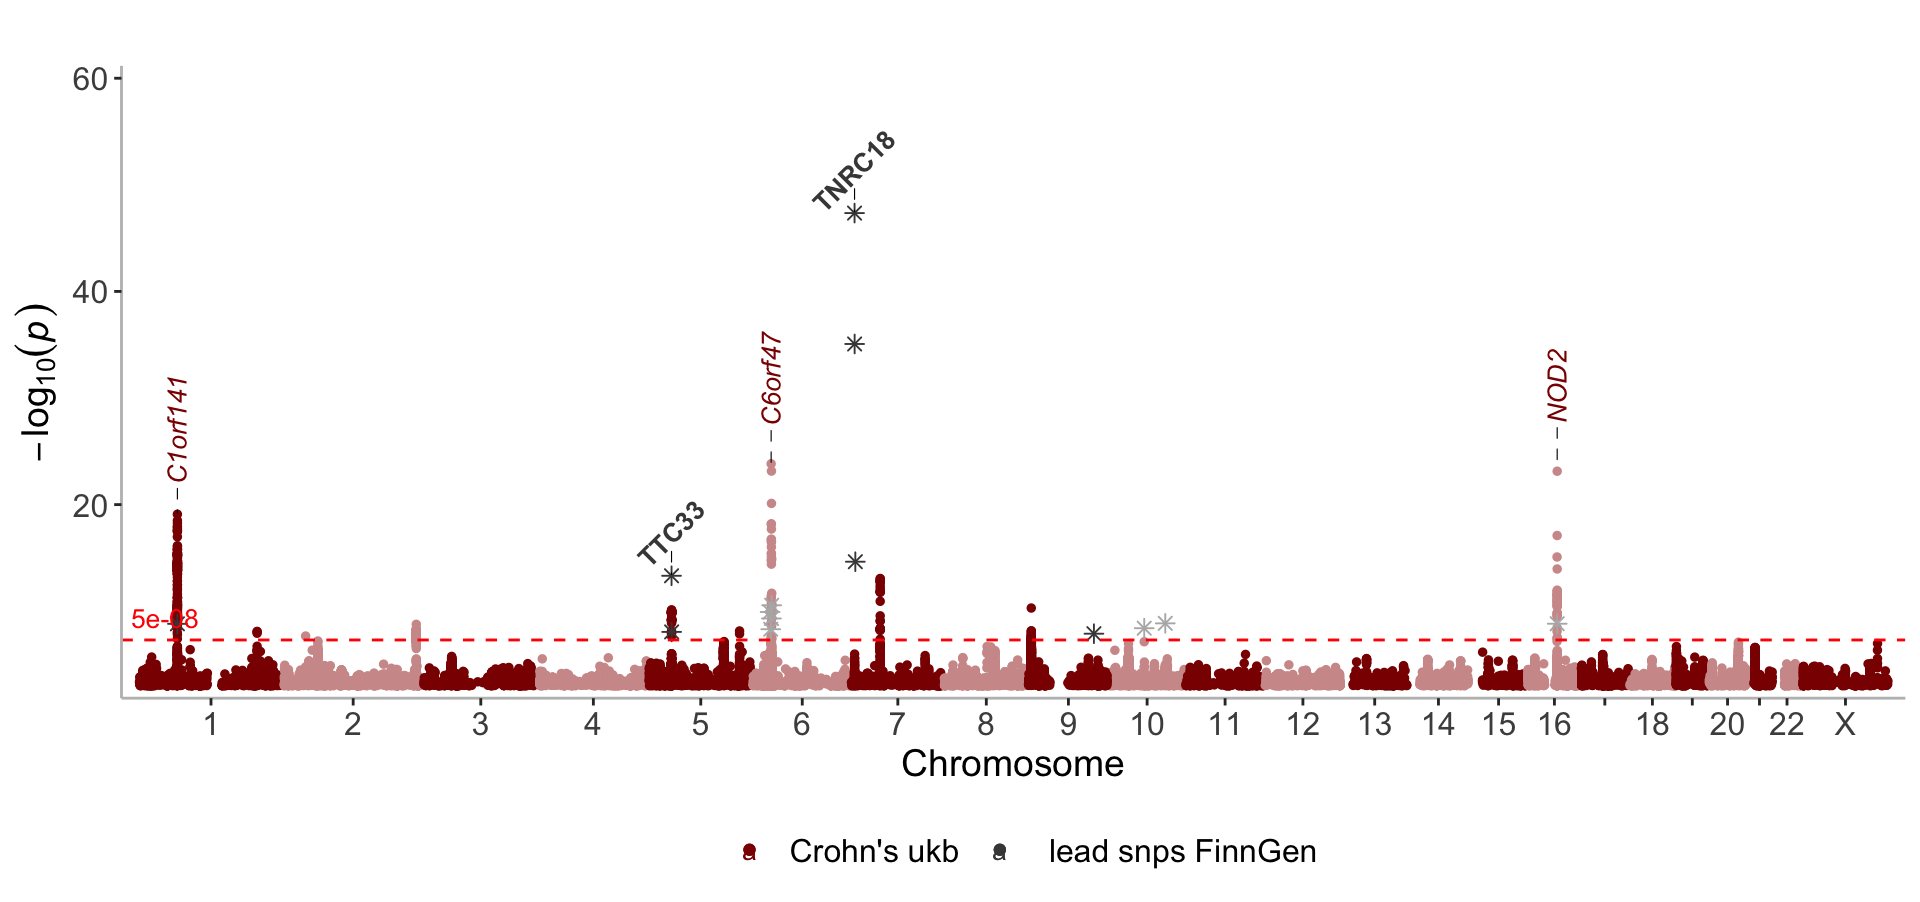
Change angle, fontface and size of labels
lead_snps_FG<- get_lead_snps(CD_FINNGEN)
manhattan(list(CD_UKBB, lead_snps_FG),
          color = c("darkred", "#464646"),
          label_fontface = c("italic","bold"),
          angle=c(90,45),
          legend_labels = c("Crohn's ukb"," lead snps FinnGen"),
          annotate=c(1e-15, 1e-12),
          ymax=60,
          nudge_y=c(8, 4),
          shape=c(19, 8), size=c(1,2))