A package for viewing and annotating genetic association data
topr functions
The main plotting functions are:
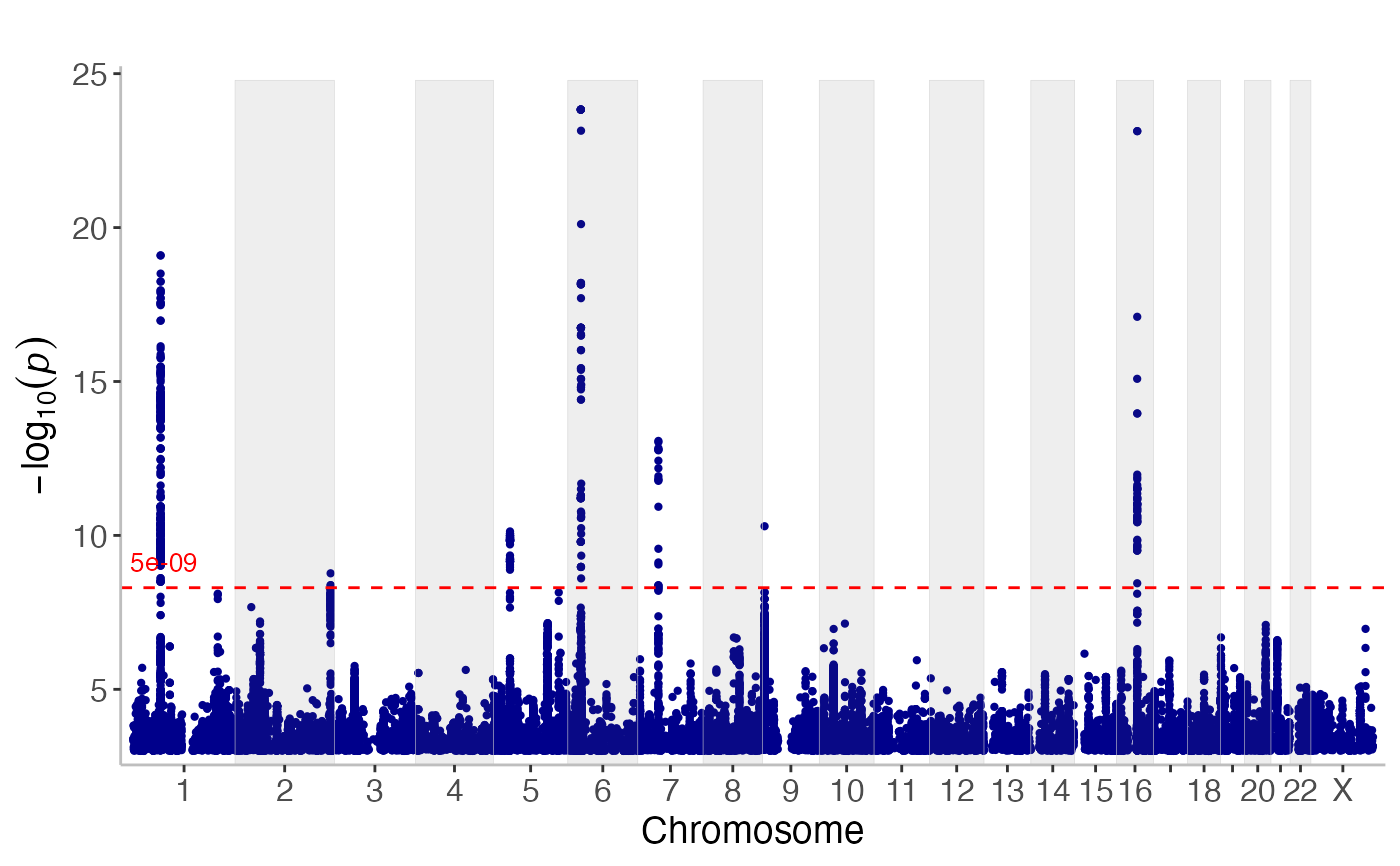
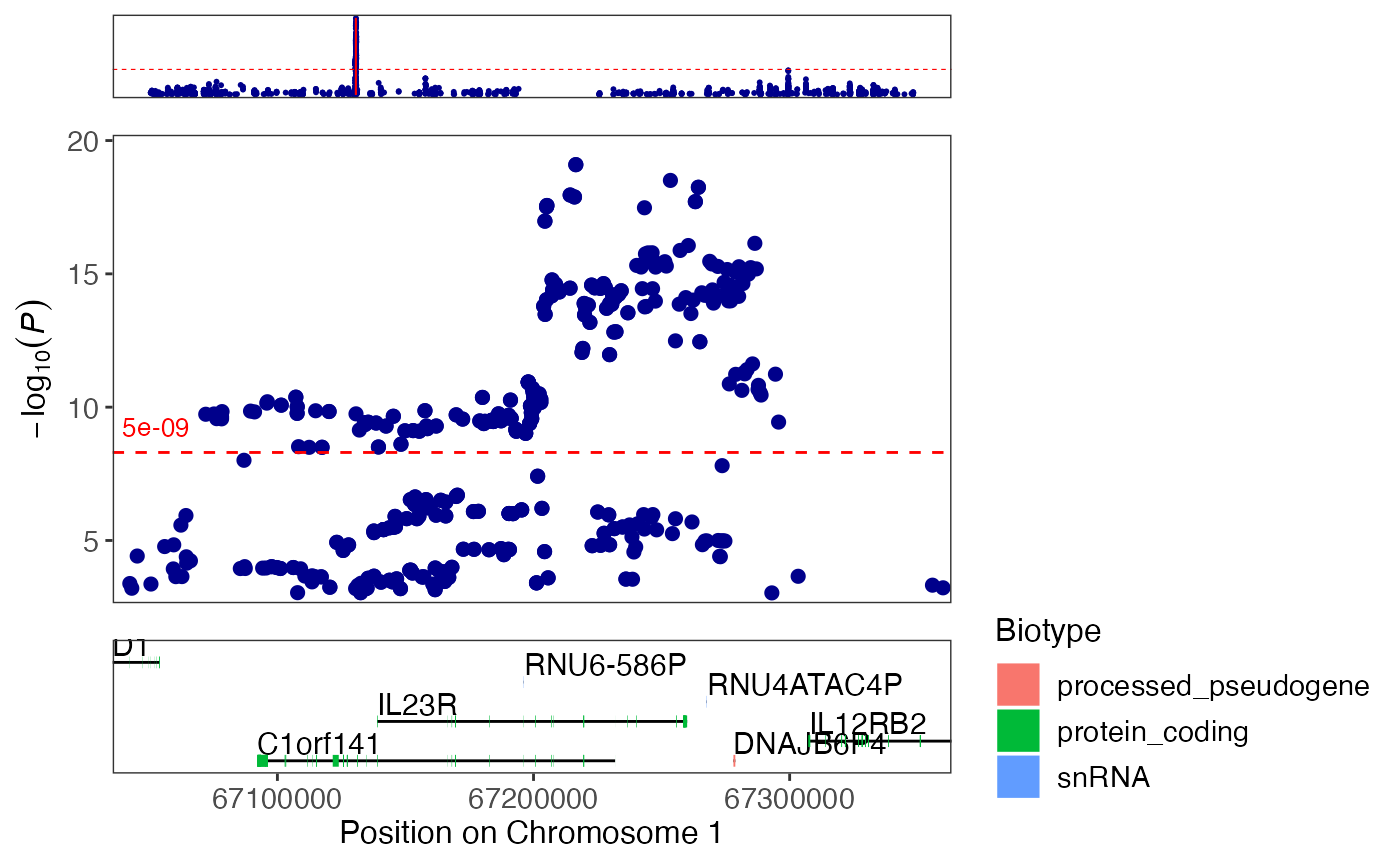
manhattanto create Manhattan plot of association resultsregionplotto create regional plots of association results for smaller genetic regions
Examples
library(topr)
# Create a manhattan plot using
manhattan(CD_UKBB)


# Create a regional plot
regionplot(CD_UKBB, gene="IL23R")
#> [1] "Zoomed to region:  chr1:67038906-67359979"


# Get the lead/index snps (the top snp per MB window)
lead_snps <- get_lead_snps(CD_UKBB)

# Annotate the index snps with their nearest gene
lead_snps_annotated <- annotate_with_nearest_gene(lead_snps)