regionplot
Zoom-in on the region around the IL23R gene:
regionplot(CD_UKBB, gene="IL23R")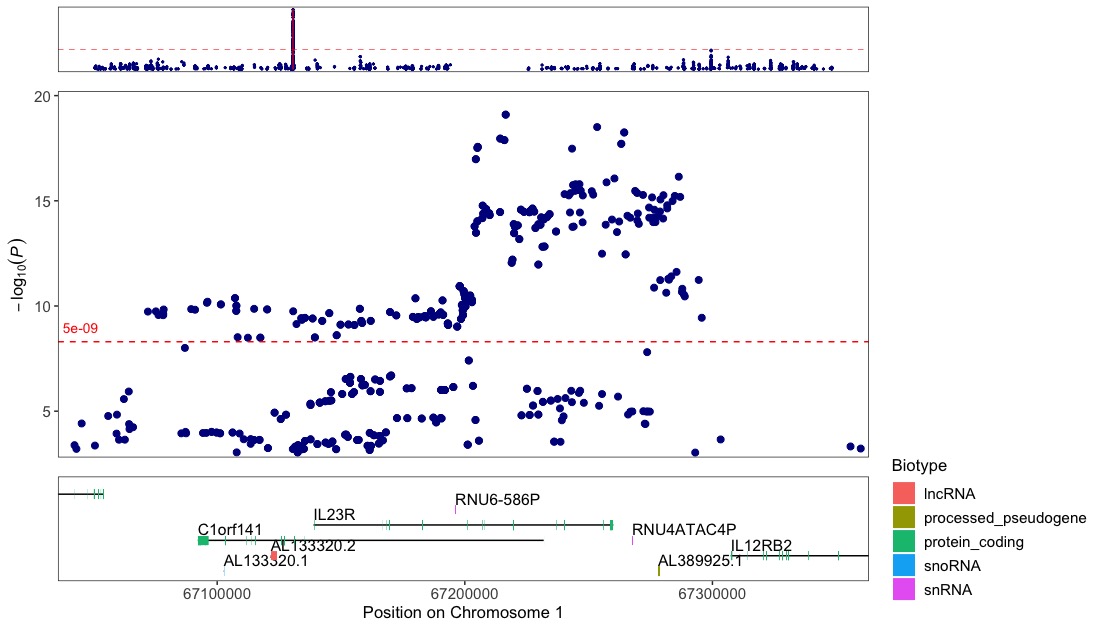
Label the top variant with it´s ID (rsid):
regionplot(CD_UKBB, gene="IL23R", annotate=5e-09)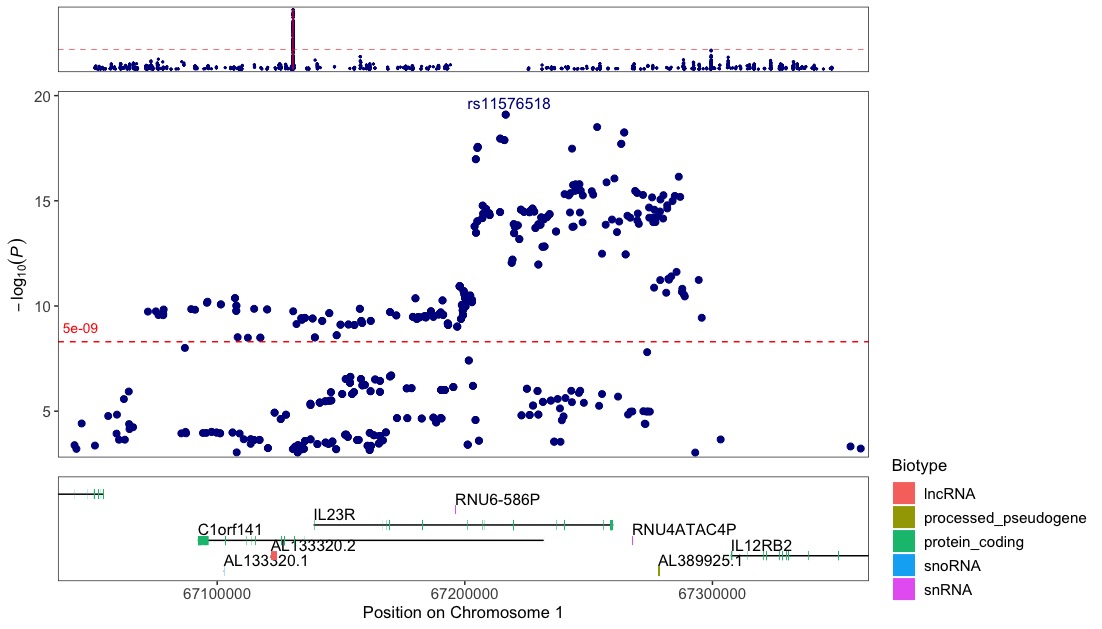
Increase the density of top variant labelling by reducing the
region_size argument to 100000.
Annotate with vlines to get a better visual of where the variants are in relation to the genes and exons shown below:
regionplot(CD_UKBB, gene="IL23R", annotate_with_vline = 5e-09, region_size = 100000)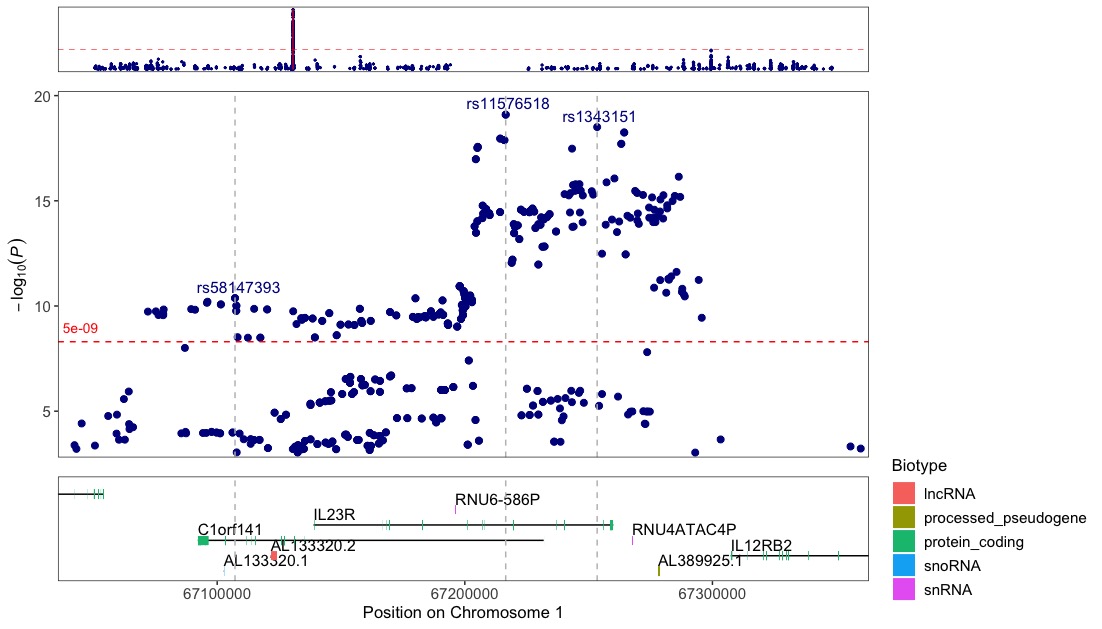
Zoom in on the IL23R gene for multiple GWASes
regionplot(list(UC_UKBB,CD_UKBB,CD_FINNGEN), gene="IL23R", annotate_with_vline = 5e-06, legend_labels=c("UC UKBB","CD UKBB","CD FINNGEN"))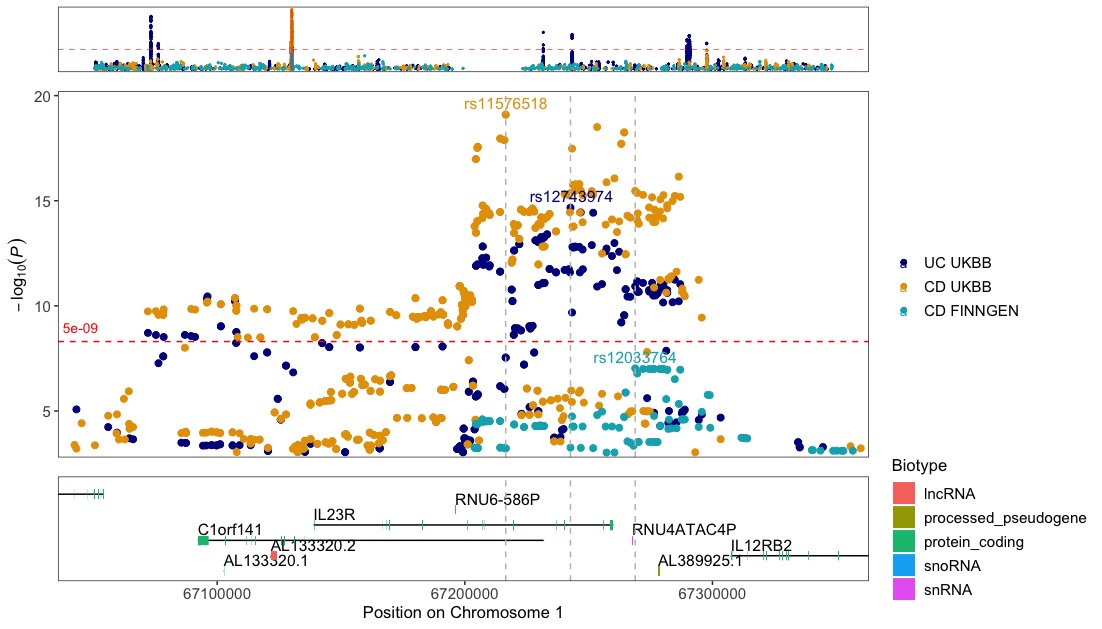
Locuszoom-like plots
Note!! To be able to use the locuszoom function the input dataframe needs to include the R2 column with the pre-calculated r2 values, since topr does not do these calculations.
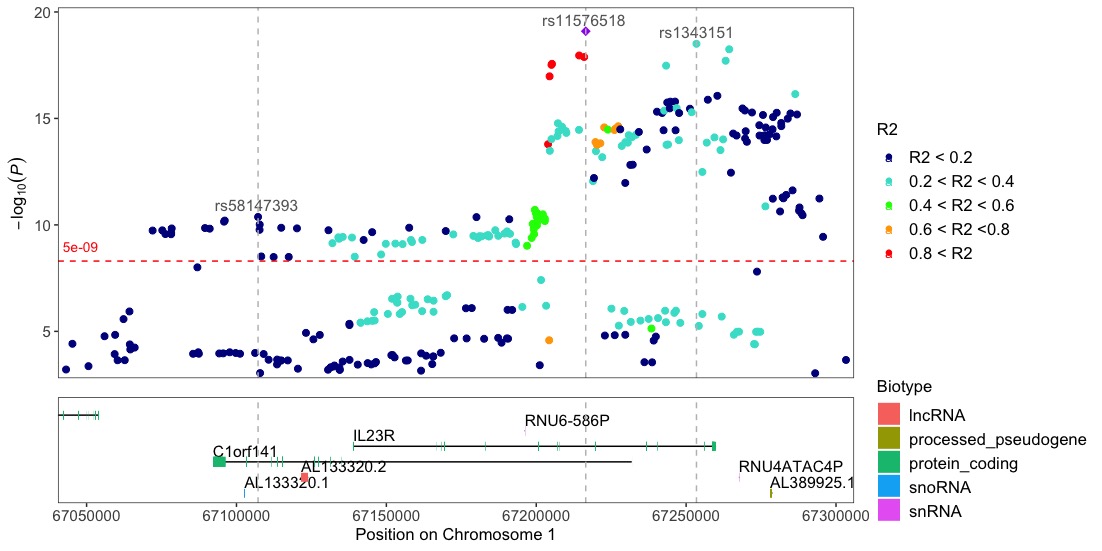
locuszoom(R2_CD_UKBB)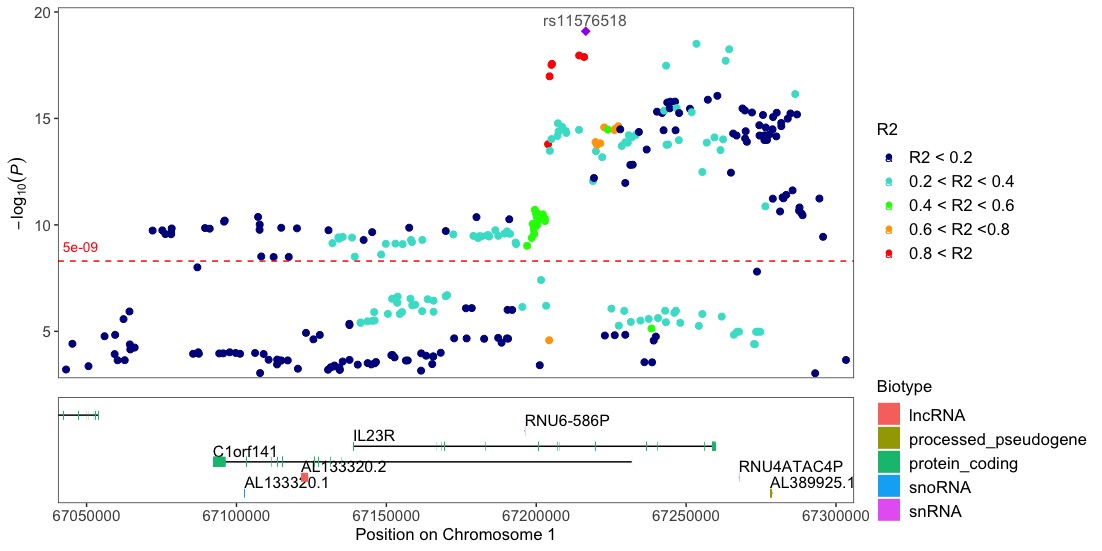
Annotate the variants with vertical lines highlighting their positions on the plot:
locuszoom(R2_CD_UKBB, annotate_with_vline = 1e-09, region_size = 100000)