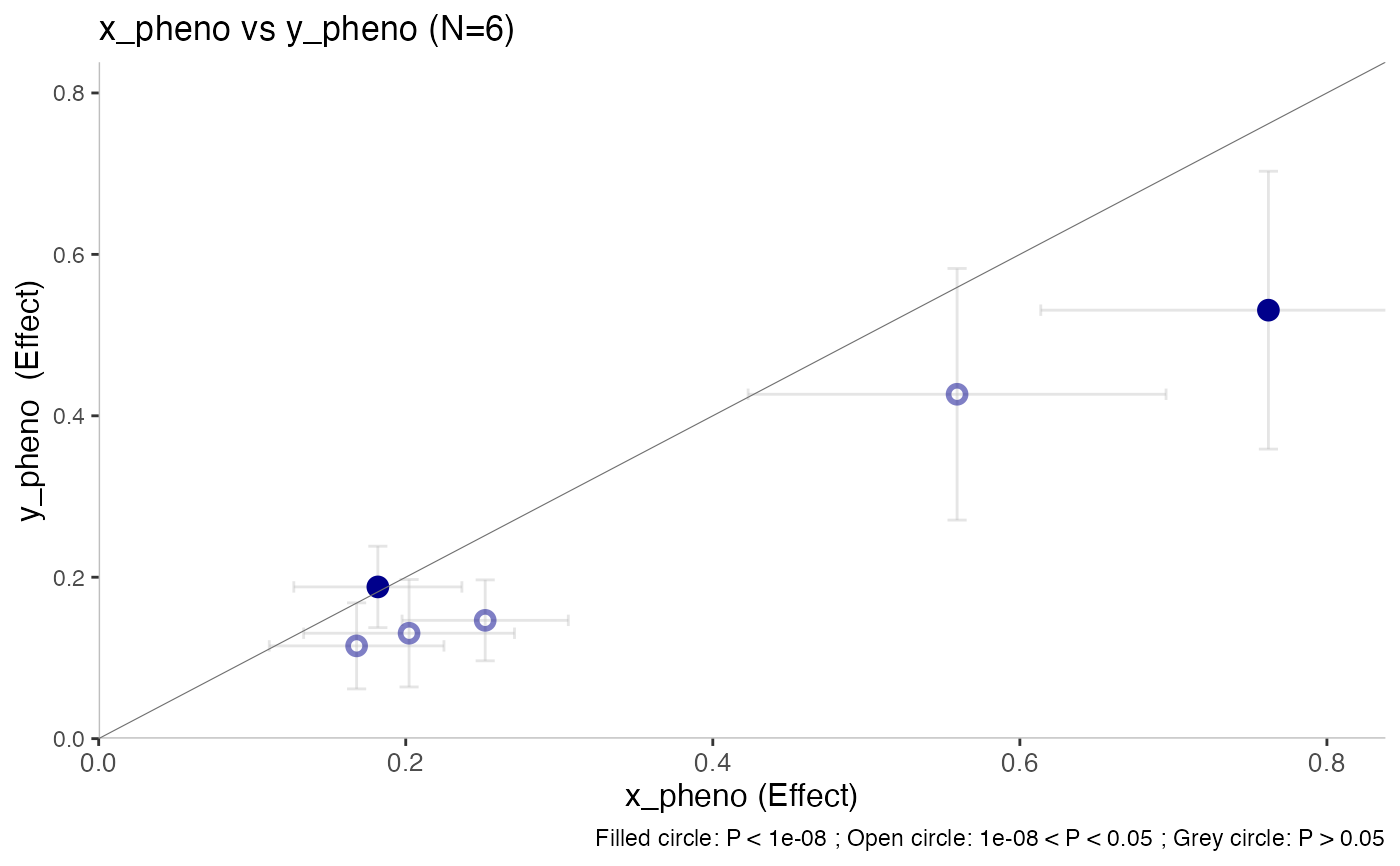
effectplot()
effectplot(
  df,
  pheno_x = "x_pheno",
  pheno_y = "y_pheno",
  annotate_with = "Gene_Symbol",
  thresh = 1e-08,
  ci_thresh = 1,
  gene_label_thresh = 1e-08,
  color = get_topr_colors()[1],
  scale = 1,
  build = 38,
  label_fontface = "italic",
  label_family = "",
  nudge_y = 0.001,
  nudge_x = 0.001,
  size = 2,
  segment.size = 0.2,
  segment.linetype = "solid",
  segment.color = "transparent",
  angle = 0,
  title = NULL,
  axis_text_size = 10,
  axis_title_size = 12,
  title_text_size = 13,
  subtitle_text_size = 11,
  gene_label_size = 3.2,
  snpset_thresh = 1e-08,
  snpset_region_size = 1e+06,
  max.overlaps = 10,
  annotate = 0,
  label_color = NULL
)
Arguments
- df
The input dataframe (snpset) containing one row per variant and P values (P1 and P2) and effects (E1 and E2) from two datasets/phenotypes OR a list containing two datasets.
- pheno_x
A string representing the name of the phenotype whose effect is plotted on the x axis
- pheno_y
A string representing the name of the phenotype whose effect is plotted on the y axis
- annotate_with
A string, The name of the column that contains the label for the datapoints (default value is Gene_Symbol)
- thresh
A number. Threshold cutoff, datapoints with P2 below this threshold are shown as filled circles whereas datapoints with P2 above this threshold are shown as open circles
- ci_thresh
A number.Show the confidence intervals if the P-value is below this threshold
- gene_label_thresh
Deprecated: A number, label datapoints with P2 below this threshold
- color
A string, default value is the first of the topr colors
- scale
A number, to change the size of the title and axes labels and ticks at the same time (default = 1)
- build
A number representing the genome build. Set to 37 to change to build (GRCh37). The default is build 38 (GRCh38).
- label_fontface
A string or a vector of strings. Label font “plain”, “bold”, “italic”, “bold.italic” (ggrepel argument)
- label_family
A stirng or a vector of strings. Label font name (default ggrepel argument is "")
- nudge_y
A number to horizontally adjust the starting position of each gene label (this is a ggrepel parameter)
- nudge_x
A number to vertically adjust the starting position of each gene label (this is a ggrepel parameter)
- size
A number or a vector of numbers, setting the size of the plot points (default:
size=1.2)- segment.size
line segment color (ggrepel argument)
- segment.linetype
line segment solid, dashed, etc.(ggrepel argument)
- segment.color
line segment thickness (ggrepel argument)
- angle
A number, the angle of the text label
- title
A string to set the plot title
- axis_text_size
A number, size of the x and y axes tick labels (default: 12)
- axis_title_size
A number, size of the x and y title labels (default: 12)
- title_text_size
A number, size of the plot title (default: 13)
- subtitle_text_size
A number setting the text size of the subtitle (default: 11)
- gene_label_size
A number setting the size of the gene labels shown at the bottom of the plot
- snpset_thresh
A number representing the threshold used to create the snpset used for plotting (Only applicable if the input dataframe is a list containing two datasets)
- snpset_region_size
A number representing the region size to use when creating the snpset used for plotting (Only applicable if the input dataframe is a list containing two datasets)
- max.overlaps
Exclude text labels that overlap too many things. Defaults to 10 (ggrepel argument)
- annotate
A number, label datapoints with p-value below below this number (in the second df) by their nearest gene
- label_color
A string or a vector of strings. To change the color of the gene or variant labels
Value
ggplot object
Examples
# \donttest{
effectplot(list(CD_UKBB, CD_FINNGEN))

# }
# }